![]()
|
||
|
|
||
The first examples used for debugging and verification of the method were two-span (2∙6.0 m) beams of a rectangular cross-section (depth = 500 mm, width = 300 mm). The beams differed in the reinforcement above the support and in the span, but the moment resistance above the intermediate support was always lower than the bending moment obtained through a linear solution and, at the same time, the reinforcement provided in the middle of the span covered the increase of the bending moment due to the redistribution of internal forces. Only physical nonlinearity was considered in the calculation. The effect of the geometrical nonlinearity is negligible in this example and, moreover, the aim was to verify the correctness and convergence of the selected method for the physical nonlinearity. The distribution of moments always converged to the expected values, i.e. if the reinforcement percentage above the support was low, the moments were redistributed towards the centres of both spans.
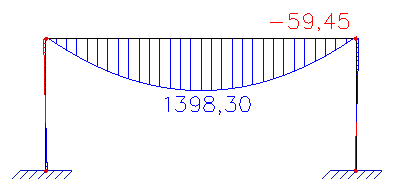
In order to illustrate the examples in question, the variant with a constant reinforcement (3φ12 S500 at the top face and 3φ14 S500 at the bottom face) along the whole length of the beam with the cover equal to 30 mm is presented here. The beam is subjected in both spans to a uniformly distributed load of 28.5 kN/m. The bending moment above the intermediate support obtained through a linear solution (FEM) is according to Fig. 1 Distribution of the bending moment in the continuous beam (a) equal to 127.6 kNm, which approaches the exact solution of 128,25 kNm. The change of the stiffness of the cross-section due to formation of cracks and plasticization of the cross-section resulted in the redistribution of internal forces shown in Fig. 1 Distribution of the bending moment in the continuous beam (b). The bending moment in the middle of the span reached the value of 83.9 kNm. The correctness of the distribution of the bending moments can be verified through a simple calculation: 83.9+88.8/2=128.3 kNm, which almost equals to the exact solution with 128.25 kNm.
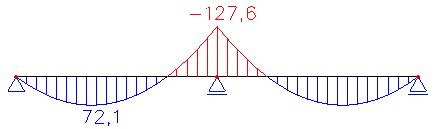
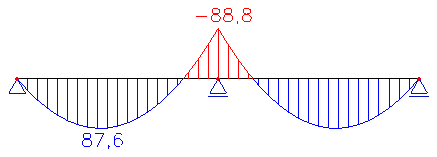
(a) linear solution(b) nonlinear solution
Fig. 1 Distribution of the bending moment in the continuous beam
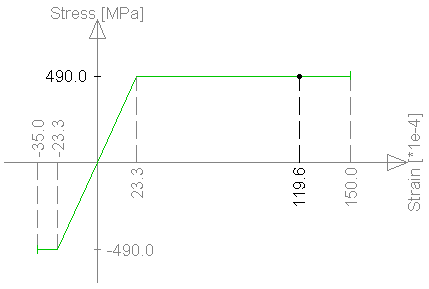
(a) concrete(b) reinforcement
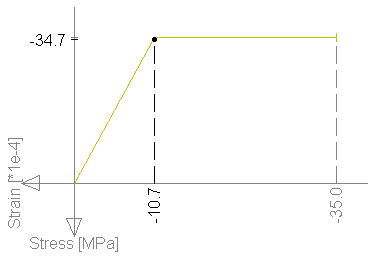
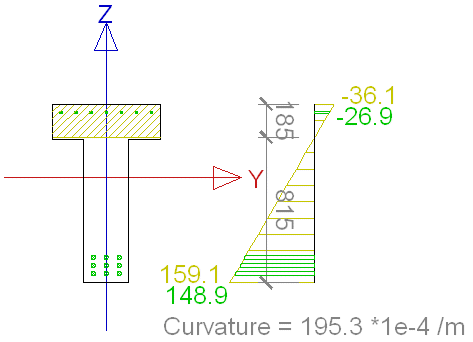
Fig. 2 Stress and strain of the most loaded fibres in the section 5.85 m
It is clear from Fig. 2 Stress and strain of the most loaded fibres in the section 5.85 m that the bearing capacity of the cross-section is fully utilised in the section above the intermediate support. In section 6.0 m, i.e. just above the support, the equilibrium of the cross-section was not even found for the calculated bending moment of minus 88.8 kNm. This requires that two assumptions of the solution be reminded. Firstly, the nonlinear analysis assumes a constant stiffness of the cross-section over the length of the finite element. The stiffness is determined from the section in the middle of the element. The length of the finite element in the analysed example was selected to be equal to 0.3 m and the stiffness was thus calculated in section 5.85 m. Secondly, we must understand that the axial and bending stiffnesses entering the static calculation of the structure (the solver) in the last executed iteration do not have to correspond exactly to the obtained internal forces, and to the response to these forces, see chapter Calculation method. It is thus possible that the stiffness of the element was determined in the solver despite the fact that the response of the cross-section to the calculated internal forces is not found.
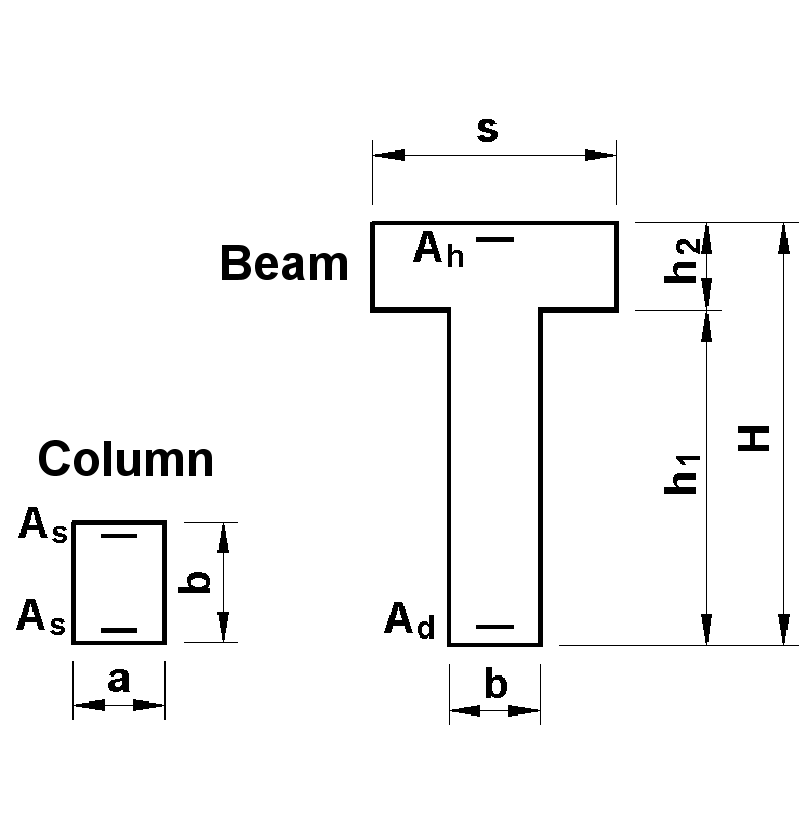
Fig. 3 One-span frame, geometry, cross-sections
Another analysed example is related to a collapse of an existing structure that happened in the 1960s. The primary aim of the calculation was to compare the ultimate limit state of the structure with the nonlinear solution described in [4]. The geometry and cross-sections of the structure are shown in Fig. 3 One-span frame, geometry, cross-sections and Tab. 1 One-span frame, geometry, cross-sections, materials.
|
span |
beam |
column |
|||||
|
L [*mm] |
H [*mm] |
h1 [*mm] |
h2 [*mm] |
b [*mm] |
s [*mm] |
a [*mm] |
b [*mm] |
|
12000 |
1000 |
800 |
200 |
250 |
600 |
250 |
300 |
|
column |
beam |
concrete C10 [*MPa] |
steel [*MPa] |
||||
|
As [*cm2] |
Ad [*cm2] |
Ah [*cm2] |
fcm |
fcd |
fck |
fyk=fym |
fyd |
|
3,08 |
42,41 |
10,78 |
14,0 |
7,0 |
10,5 |
380 |
330 |
Tab. 1 One-span frame, geometry, cross-sections, materials
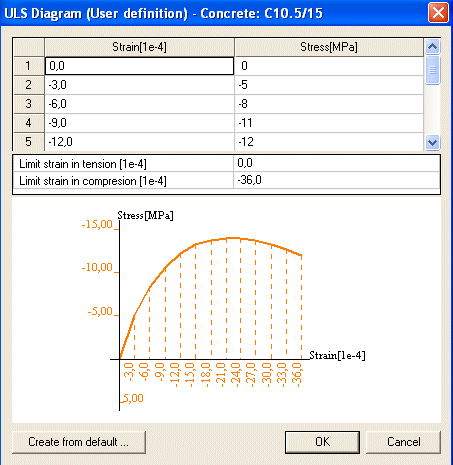
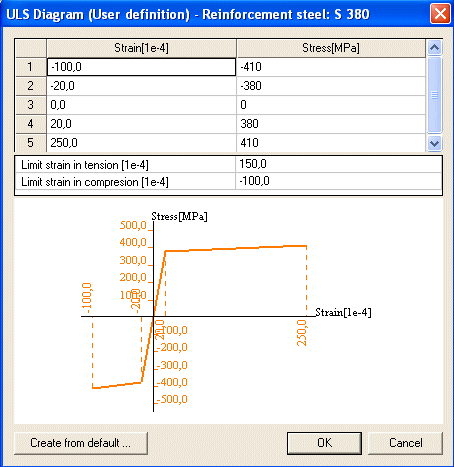
Due to lack of more accurate data, three variants of stress-strain diagrams were used for the physically nonlinear calculation. The first one was a parabolic stress-strain diagram with a declining branch for the concrete and bi-linear stress-strain diagram with hardening for the reinforcement, see Fig. 4 Stress-strain diagrams. Material characteristics contained in [4] were taken into account, others were estimated. This variant is in the following text named ESA /1/.
(a) concrete(b) reinforcement
Fig. 4 Stress-strain diagrams
With regard to the fact that the cited literature did not give a clear picture of the shape of the stress-strain diagrams, some calculations were performed also with a parabolic stress-strain diagram for the concrete with a constant plastic branch and bi-linear stress-strain diagram without hardening for the reinforcement. This calculation variant is in the following text marked as ESA /2/.
Also problematic was the interpretations of the note that the limit strength of the concrete in column heads was considered by the value of 7.0 MPa and in other parts of the structure by the mean value of 14.0 MPa. It is probable that the authors of [4] used the average properties for the physically nonlinear analysis and then applied the design strength value in the checks of critical sections, see chapter 3. Therefore, the alternative called ESA /3/ analysed the structure using the stress-strain diagram with a reduced strength in compression (7.0 MPa) in columns with all other characteristics identical to variant ESA /2/.
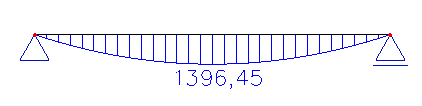
According to [4], the anchoring of the column reinforcement into beams was adequate. Therefore, the system acts as a frame. With regard to the slenderness of the columns it is probable that increasing load results in the formation of plastic hinges in the column heads and that the beam then acts separately. The bearing capacity of the structure thus corresponds to the bearing capacity of the beam. This, however, depends directly on the bearing capacity of the cross-section of the beam in the middle of the span, as we deal with the bearing capacity of a statically determined structure. Consequently, the ultimate bearing capacity of the beam acting as a simple beam was analysed in the first step. The obtained ultimate bearing capacity for the variant ESA /1/ was 77.6 kN/m, which corresponds to bending moment 1396.8 kNm that is also the bending resistance of the cross-section, see Fig. 5 Stress and strain in the cross-section in the middle of a simple beam subjected to the force of 77.6 kN/m. It is clear from Tab. 2 Ultimate bearing capacity of the frame and the beam that it differs from the ultimate bearing capacity according to [4] by approximately 4 %, which may be due to the numerical error of the iteration adjusted for this case to 3 %, but also due to possible deviations in the input data (for example reinforcement cover was not mentioned in [4]).
(a) strain(b) stress
Fig. 5 Stress and strain in the cross-section in the middle of a simple beam subjected to the force of 77.6 kN/m
The real redistribution of internal forces and stresses could, however, manifest itself only in the analysis of the whole frame. Due to the differences in dimensions and reinforcement of the columns and the beam, we can expect early utilisation of the bearing capacity of the cross-section in the column head. On the other hand, if the capacity of rotation in the head of the column is sufficient, the load can be increased until the bearing capacity of the cross-section in the middle of the beam spam is reached. This will be accompanied by enlargement of the plastic zone in the column head. Tab. 2 Ultimate bearing capacity of the frame and the beam compares the results of solution obtained in [4] and by the SCIA Engineer program.
|
|
calculation [4] |
ESA /1/ |
ESA /2/ |
ESA /3/ |
|||||
|
nonlin |
plast |
||||||||
|
Beam |
Bearing capacity of beam [kN/m] |
81.0 |
- |
77.6 |
|
|
75.6 |
|
|
|
Max εcc [*10-3] |
|
|
-3.61 |
|
|
-2.99 |
|
||
|
Frame |
Bearing capacity of frame [kN/m] |
58.0 |
79.0 |
77.6 |
79.0 |
81.0 |
79.0 |
58.0 |
|
|
Max εcc [*10-3] |
column |
-2.00 |
|
-1.96* |
-2.16* |
-2.73* |
-2.39* |
-2.3* |
|
|
Max εcc [*10-3] |
beam |
|
|
-1.91 |
-2.33 |
-3.45 |
-2.98 |
-8.9 |
|
Tab. 2 Ultimate bearing capacity of the frame and the beam
The cited literature also mentions what is termed “bearing capacity obtained through a nonlinear analysis at reaching the ultimate state of concrete crushing” as equal to 58 kN/m. Other place states the value of 2 ‰ as the limit compressive strain in concrete. If we take these two pieces of information and consider them to be the obtained strain value in the column head under the acting load of 58 kN/m, then the variant ESA /3/ gives almost complete concordance with the cited literature. It must be mentioned here that the strain values marked in Tab. 2 Ultimate bearing capacity of the frame and the beam by the asterisk, are the values calculated in the theoretical joint. Fig. 6 Distribution of strain over the frame (b) shows that the strain is lower at the face of the connection of the column to the beam (values exceeding 2 ‰ are drawn in red).
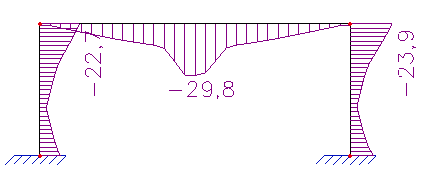
(a) ESA /2/, load 79 kN/m(b) ESA /3/, load 58 kN/m
Fig. 6 Distribution of strain over the frame
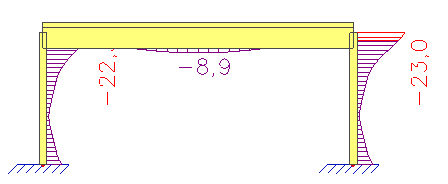
It is clear from the figure that the bearing capacity of the beam is far from being utilised under the load of 58.0 kN/m. Therefore, it does not represent the real limit load of the structure.. This is in agreement with the data in the cited literature concerning the ultimate bearing capacity of 79 kN/m that was obtained through a plastic analysis. Tab. 2 Ultimate bearing capacity of the frame and the beam gives a clear picture of a good correspondence between (i) the solutions ESA /1/ and /2/ and (ii) the cited literature. With regard to the fact that the structure is statically indeterminate, the bearing capacity of the structure as the whole depends on the strain capacity of the materials – that means on the size of the plastic zones in the heads of the columns and in the middle of the beam. If the strain capacity is sufficient, the bearing capacity of the structure determined for ESA /1/ equals to 81.0 kN/m. The increase in comparison with the value of ultimate bearing capacity of the beam can be explained by the bending moments in the plastic hinge in the joint between the columns and beam – see Fig. 7 Distribution of bending moments after redistribution. In this regard, the statement made in [4] that the bearing capacity of the beam if it acts as a simple beam is bigger than the bearing capacity of the frame as a whole obtained through a plastic analysis is rather debatable.
(a) ESA /1/, load 81 kN/m(b) beam as a simple beam, load 77.6 kN/m
Fig. 7 Distribution of bending moments after redistribution
The concordance between the results of the nonlinear and plastic analyses made in [4] and by the SCIA Engineer program is quite good, see Tab. 2 Ultimate bearing capacity of the frame and the beam, in particular with respect to the uncertainty in the material characteristics, stress-strain diagrams and other data.
The aim of the carried out calculations made in SCIA Engineer was neither to discover the reason for the collapse of the frame nor to find the actual bearing capacity at the collapse. Nevertheless, let us try to find out the reasons for the dramatic difference between the calculated bearing capacity and the actual load at the collapse which was 35 kN/m. This difference is beyond all possible doubt caused by the differences between the input material parameters and the real ones. As already stated in [4], it is highly probable that there was an extensive degradation of the concrete in top parts of the columns and that the anchorage of the reinforcement was insufficient. These facts were, however, not taken into account in the performed analyses and, therefore, these input data were overrated.
The importance of correct input data for results of a nonlinear analysis is clear also from the above-proved important dependence between the bearing capacity of the structure and the strain capacity in the head of the column. The magnitude of the limit strain of concrete can significantly reduce the actual total bearing capacity of the structure.