Steel - Lapped purlin/girt AutoDesign (only IBC code)
Generally, there is special Autodesign available only for NAS 2007 check for purlins (ASD or LRFD code). The algorithm changes either the cross-section or the length of the overlap. The Autodesign of lapped purlins is the same part as the Autodesign located in the standard Steel > ULS Check > Check LRFD resistance.
Autodesign in Check LRFD service
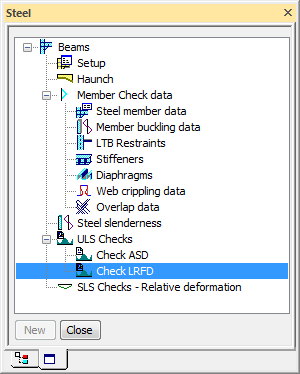
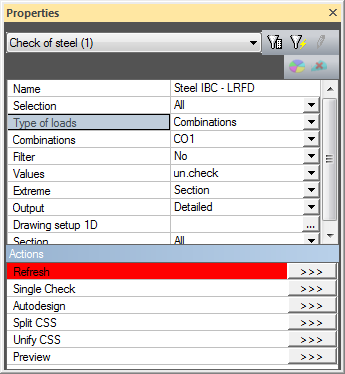
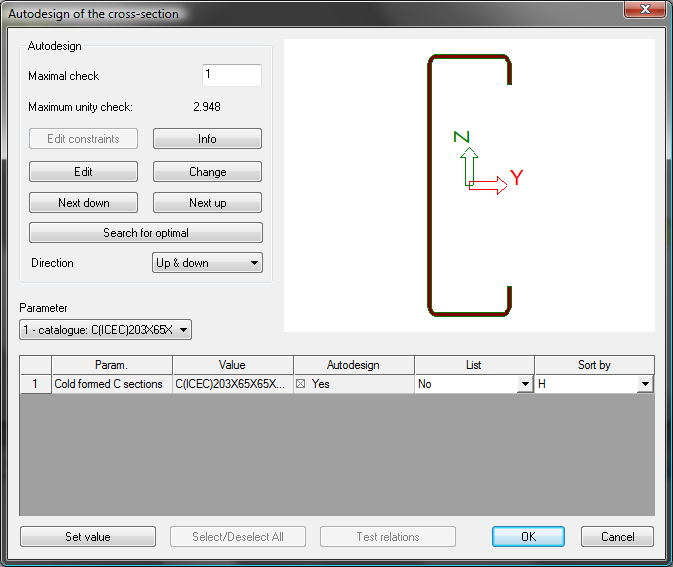
When the user clicks on action button Autodesign then the following dialogue is shown. The dialogue is a bit different from the one used in the general Autodesign dialogue but the functionality is the same.
Illustrative example
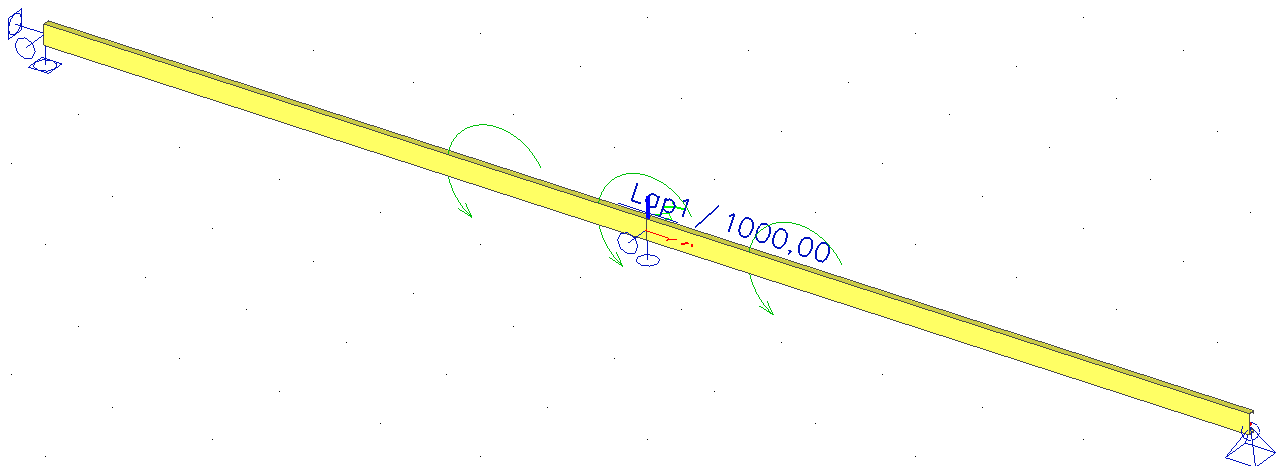
Let us consider a very simple example of a continuous steel purlin made of a cold formed C section for Autodesign. The purlin overlap should be designed for bending moment 20kNm. The aim of this example is to find the optimal height of the cross-section or length of the overlap.
The Autodesign function is defined for the cold-formed C section. The cross-section is cold formed therefore the properties of Autodesign for rolled and cold formed cross-section are used. You can see the settings in the following figure.
The additional properties are:
Type of check
it is possible to select between ASD code and LRFD code
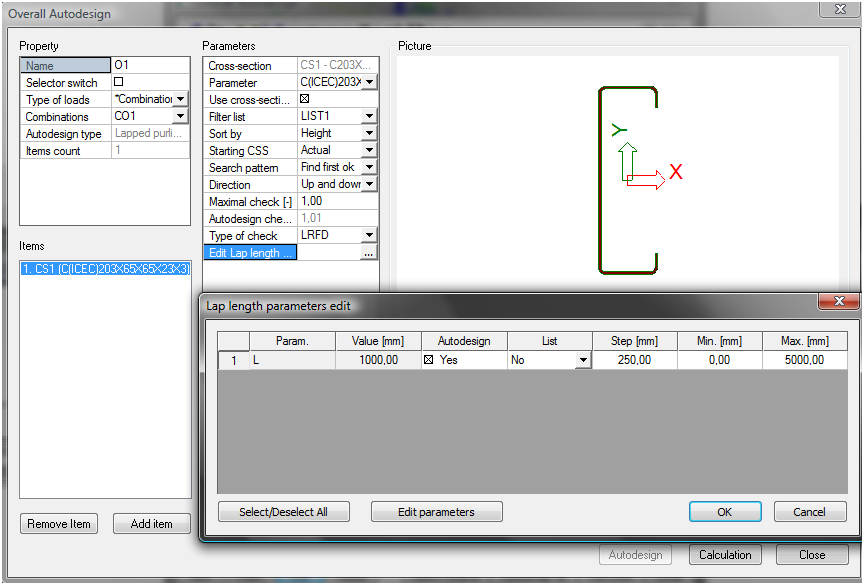
Edit Lap length
Autodesign settings for the overlap
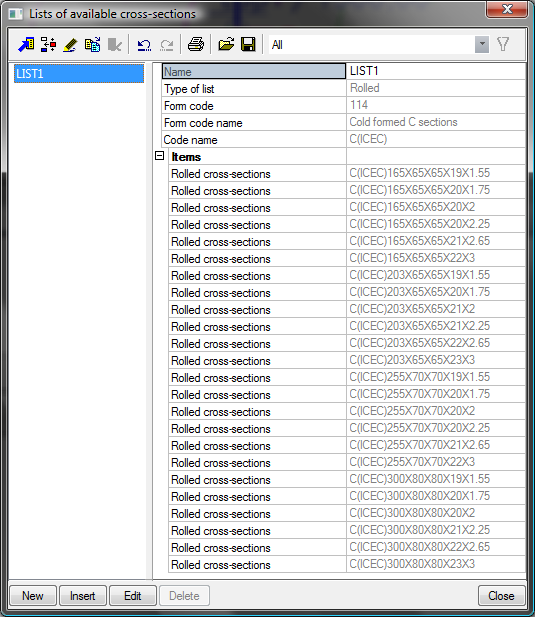
The following cross-sections are inserted to the Cross-section list.
In fact the lapped purlin Autodesign decides between the cross-section change and length change. The cross-section optimization of the whole member is already included. Note that in the example, a fixed list was used to avoid a change in cross-section so specifically the change in length could be tested.
Autodesign of both cross-sections can be run in one step using Autodesign all.
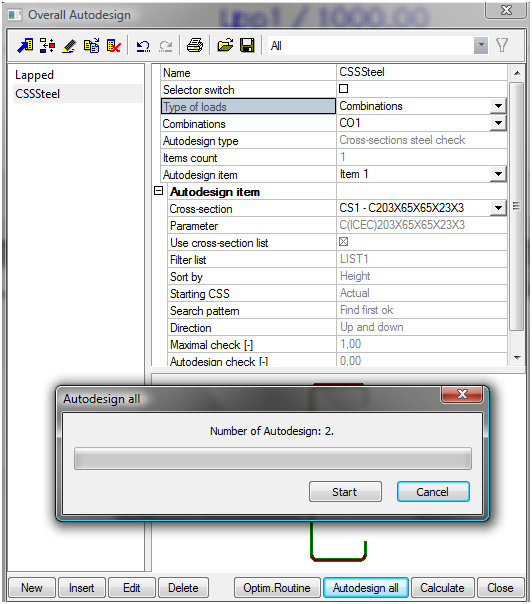
The results are automatically printed in preview.
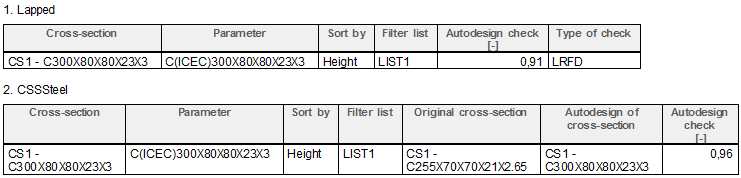
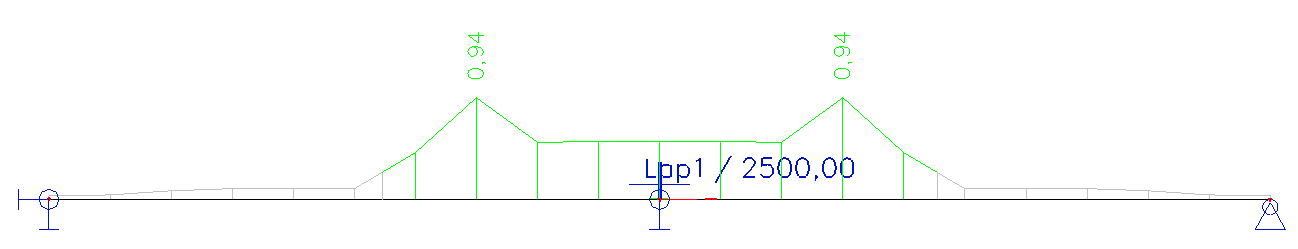
The comparison of the initial and optimized values of the cross-section is clear from the following table. The length of the overlap increased from 1000 to 2500mm.
|
Initial |
Optimized |
|
|
|
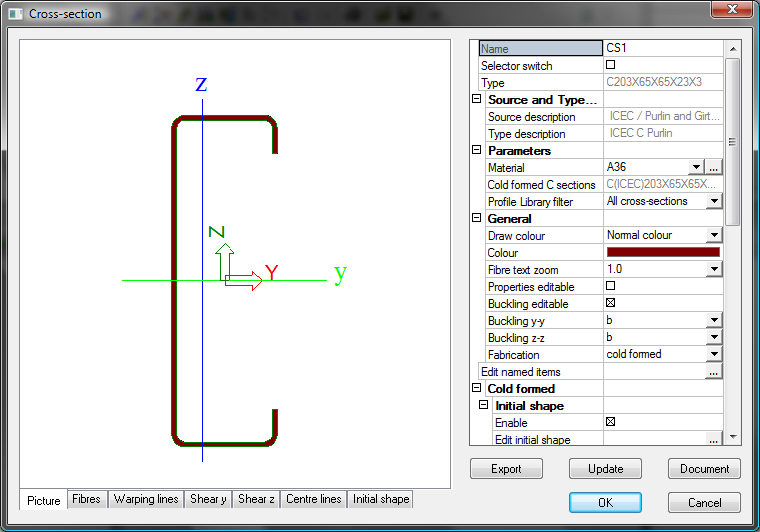
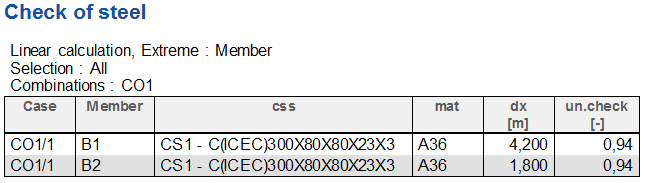
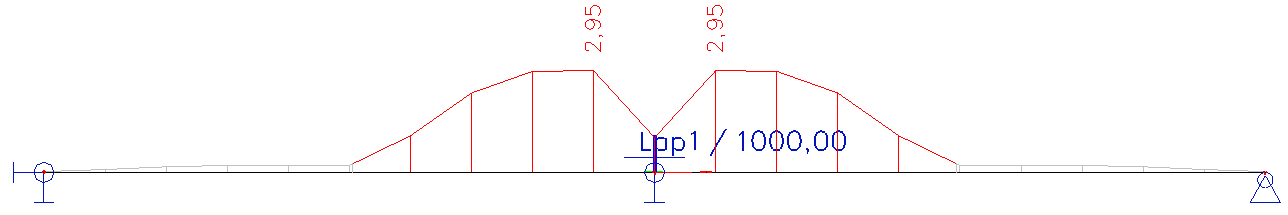
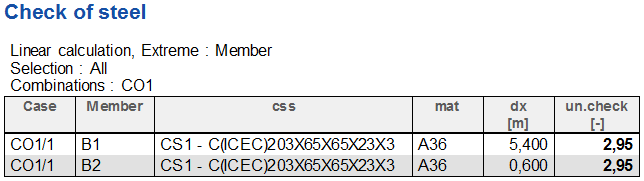
Evaluation of the rolled cross-section unity check along the beam is compared in the following figures. The first figure together with the table is for the initial cross-section.
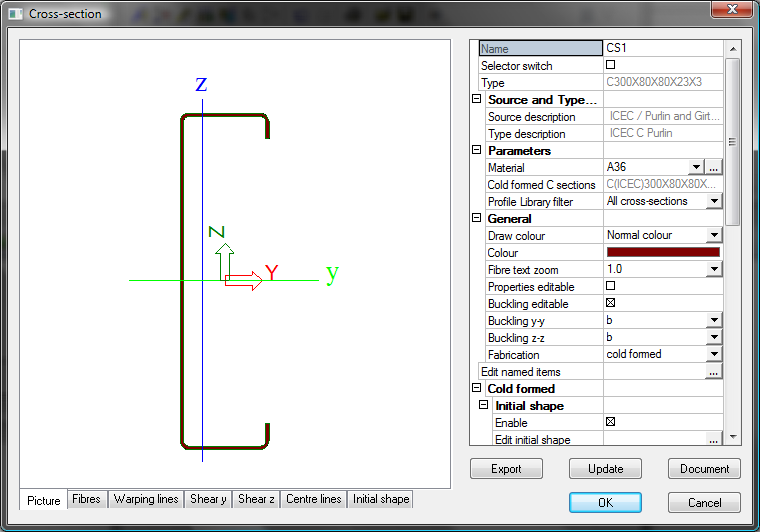
The second figure together with the table is for the optimized cross-section.