Nonlinear analysis - Benchmark: Double clamped beam
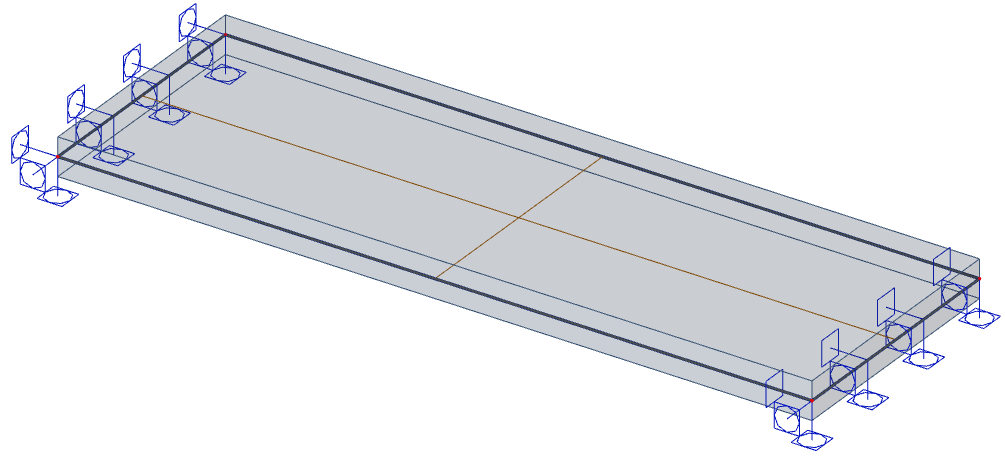
Very simple example of Double Clamped beam loaded by surface load was used for demonstration of usability and correctness of result of non-linear calculation of steel fibre reinforced concrete.The slab with span 3,0m, 1,0m width and thickness of 150mm from material C30/37-30kg/m3-5D65/60BG is used. The slab is supported in both sides restraining all the translation and rotations. But be aware one translation in longitudinal direction of the slab must be free. The nonlinear analysis with this support in X direction significantly influences the result of non-linear calculation.
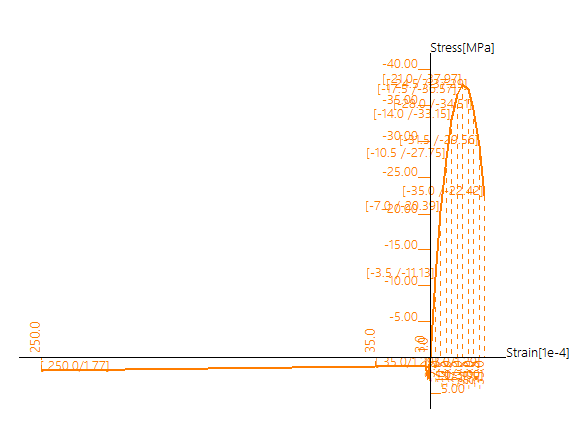
Here you can find stress strain-diagram for nonlinear analysis
Hand calculation
Based on hand calculation we can find the surface load corresponding to plastic bending moment of this structure.
The first crack strength (ffl) is considered equal to mean tensile strength (fctm) of the concrete determined based on formulas from [2] EN1992-1-1
ffl=3,00MPa
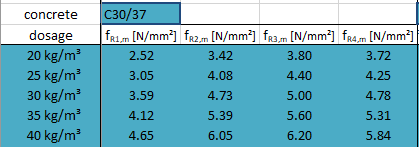
In opposite side post cracking strength (ffl,II) is coming from average residual flexural strength (fR4,m). In this case we can use also multiplication factor of 1,04 used in [1] DAfStb Guideline "Steel fibre reinforced concrete". Value fR4,m is determined based on the tests for certain concrete grade, fibre type and dosage.
f,fl,II=fR4,ml=1,04.4,78 = 4,97MPa
See steps of hand calculation to obtain maximal plastic load of this structure.
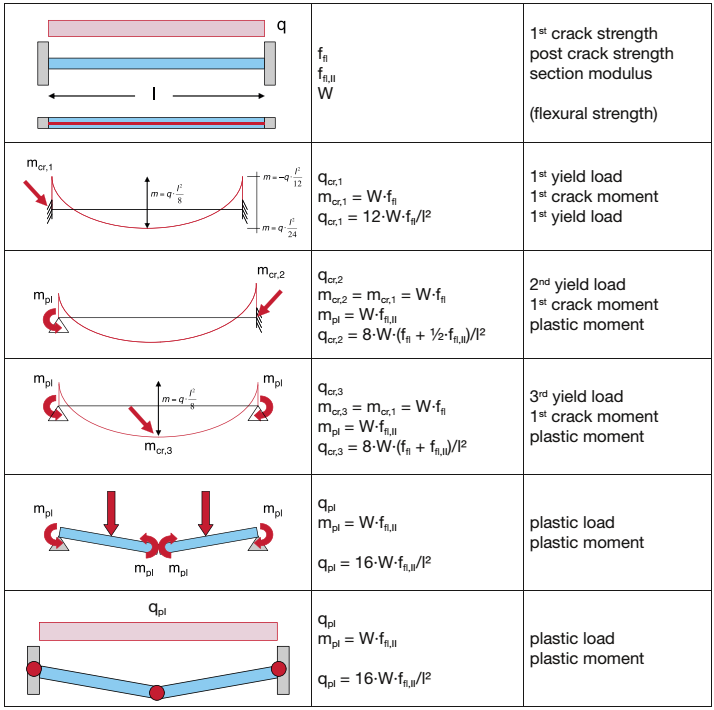
The first crack
The value of load corresponding to first crack is calculated as
qcr,1 = 12.W.ffl/ l2 = 12.0.00375.3,00 / 32 = 15,0kN/m2
and cracking moment is in fact
mcr =W.ffl=0.00375.3,00 = 11,25kNm/m
Plastic behaviour
The final value of plastic load is in fact the following
qpl = 16.W.ffl,II/ l2 = 16.0.00375.4,97 / 32 = 33,1kN/m2
and finally plastic bending moment
mpl =W.ffl,II=0.00375.4,97 = 18,64kNm/m
Inputs
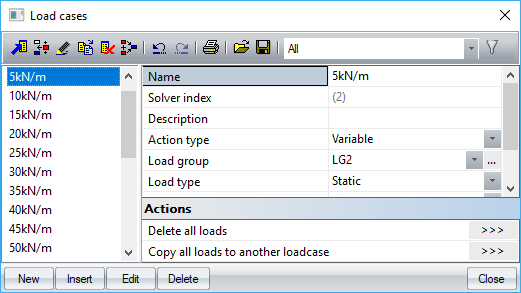
Theo goal of this research is to find the surface load corresponding to plastic state of the structure in the upper fibres above the support. We can prepare set of load cases where the load is increased by ste. LC-5kN/m2; LC-10kN/m2; LC-15kN/m2; LC-2kN/m2; LC-25kN/m2; LC-30kN/m2; LC-35kN/m2; LC-40kN/m2; LC-45kN/m2; LC-50kN/m2
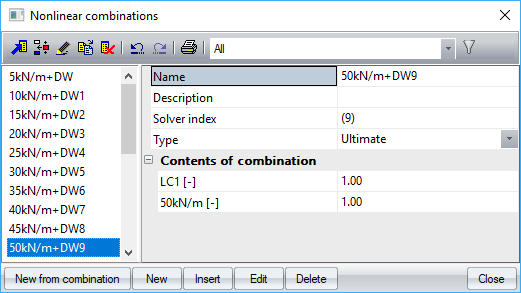
The same scenario is the preparation of Nonlinear combinations
The non-linear calculation using Newton Raphson method s is run with mesh size can be set as h/2 = 0,075mm for this example.
Results analysis
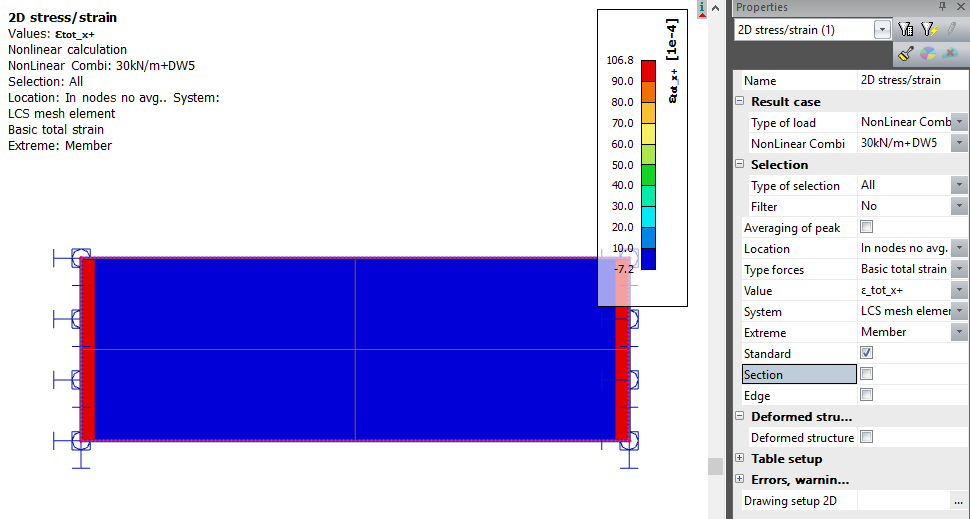
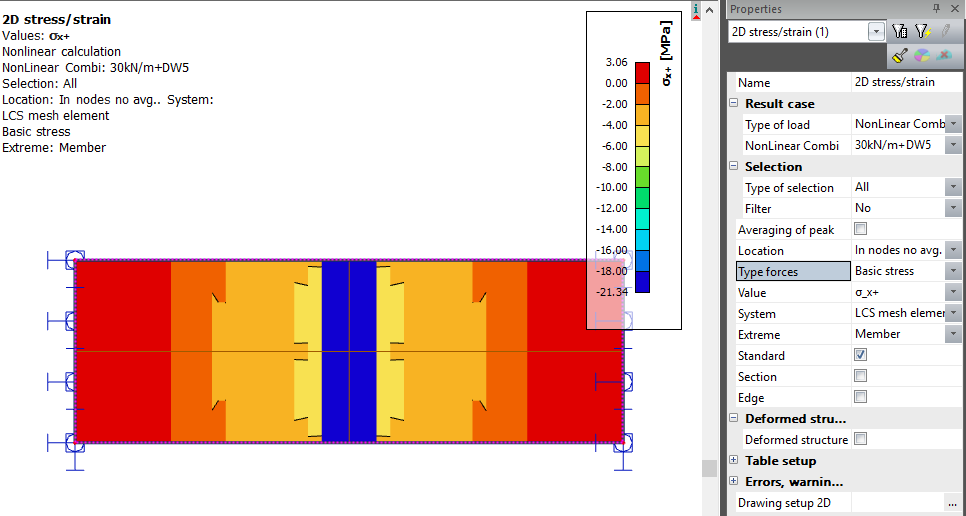
When the non-linear calculation is getting converged then we can perform analysis of the results. We are going to investigate the upper fibres above the support. Thus we can define section above support. At first we can look and Basic strain and stress for each non-linear combination (as you can see here for nonlinear combination 30kN/m2)
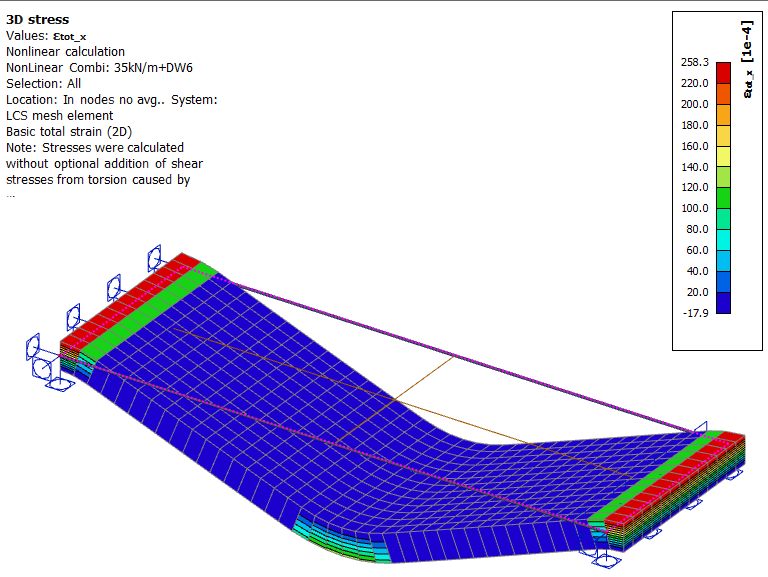
Additionally, very efficient method to have overall imagine about the structure behaviour is displaying results via 3D result together with deformations, see below.
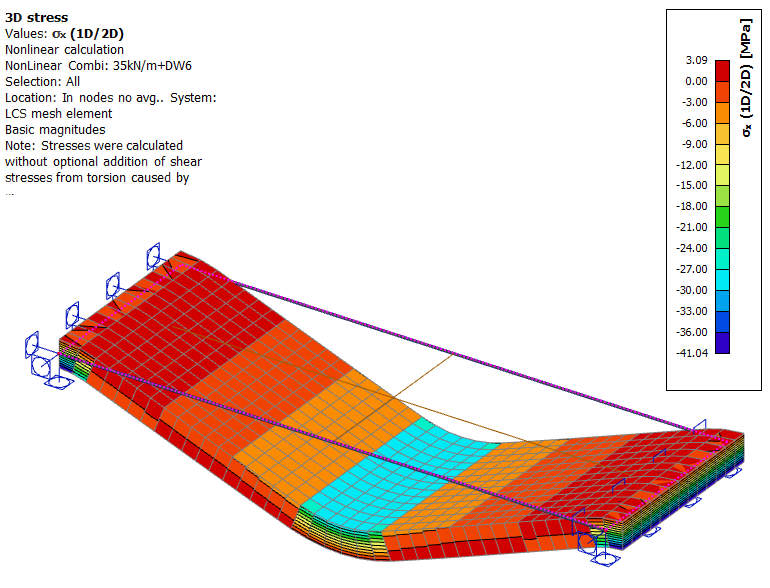
Now we can easily see the results of strain and stresses for each non-linear combination. The table shows the value of the load corresponding to plastic bending moment. Thsi valeu is somewhere between 34-35kN/m2
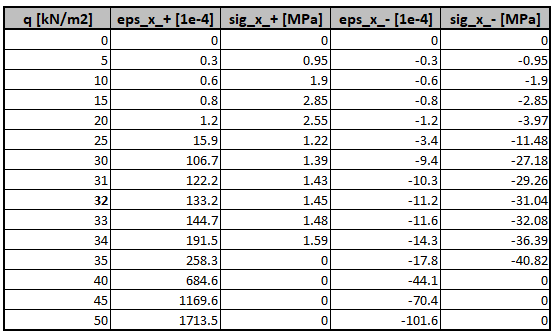
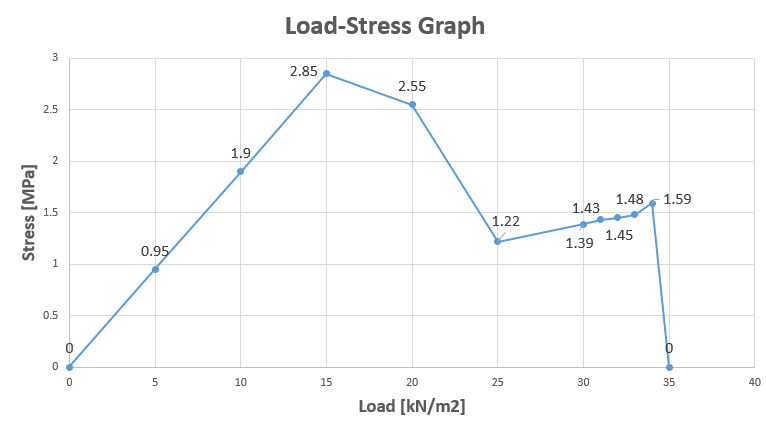
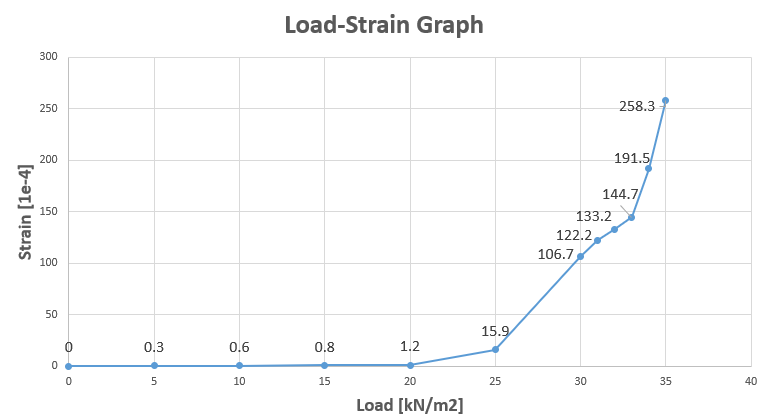
We can also make a graph of dependency between load level and strain and stress. If we look at the Load-Stress distribution, we can deduct the behaviour of the structure is linear till value of 15kN/m2, This perfectly corresponds with stress-strain diagram with small peak of diagram in tension. We are approaching to top of the peak till value of 15kkN/m2. It is also visible from the strain table that for this load we obtain strain 0,8*1e-4 which is lower than 1,0 representing strain of the top of the peak.This proofs our first precondition of qcr,1 which is calculated as 15kN/m2. After that there is a phase of crack formation and stress is coming significantly down based on the stress-strain diagram. The residual strength in tension (1,22MPa) is reached somewhere between 20-25kN/m2 corresponding to strain 3,0*1e-4.The load higher than value 25kN/m2 means the spreading of the cracks with smooth hardening of the material done by increasing branch of stress-strain diagram in tension till value 1,77MPa and strain. 250*1e-4. The plastic load is reached by the load 34-35kkN/m2 where the strain 258,3*1e-4 exceeds the limit 250*1e-4
Additionally, the upper fibres of the slab above support are neglected for calculation for higher load due to exceeding the strain limit and the structure is considered as fully cracked. Nevertheless the middle of the slab is still able to carry some load. When we look at the centre of the slab.
Moreover we can compare also bending moment with estimation done by hand calculation. In this case, the bending moment above support corresponding to first crack for load level 15kN/m2 is mcr = 10,69kNm/m and plastic moment corresponding to load level 35kN/m2 is mpl = 18,40kNm/m. These values are perfectly in coincidence with estimation provided by hand calculation.
Conclusions
The non-linear calculation performed in Scia engineer provides very good relationship with hand calculation. The load corresponding to first crack is completely the same in comparison with hand calculation.(15kN/m2). The limit of surface load corresponding to plastic bending moment obtained by non-linear calculation is 34,5kN/m2 and estimated by hand calculation is 33,1kN/m2 which is considered as acceptable. From the point of bending moments, the value of cracking moment is really equal to hand calculation. The last compared value is plastic bending moment 18,4kNm/m which is also very close to value from hand calculation 18,64kNm/m. The study proofs that this tool can be used for analysis of 2D structures and modelling of real behaviour of the structure with respect of cracks.
| Hand calculation | SCIA Engineer | |
| mcr[kNm/m] | 11,25 | 10,69 |
| qcr[kN/m2] | 15,0 | 15,0 |
| mpl[kNm/m] | 18,64 | 18,40 |
| qpl[kN/m2] | 33,1 | 35,0 |