Displaying the soil structure strength
The procedure to display the soil structure strength
-
Select function Subsoil - Other data.
-
Select the slabs for the display of results.
-
The program generates points in centroids of 2D mesh elements (Vertexes are only generated on those 2D elements which have Soilin support data defined).
-
Select the required point where the diagram is to be displayed.
-
The program opens a dialogue with the diagram.
-
If required, use button Previous or Next to move to another point.
-
Alternatively, select a borehole from the combo box to review the results for a locations of the required borehole.
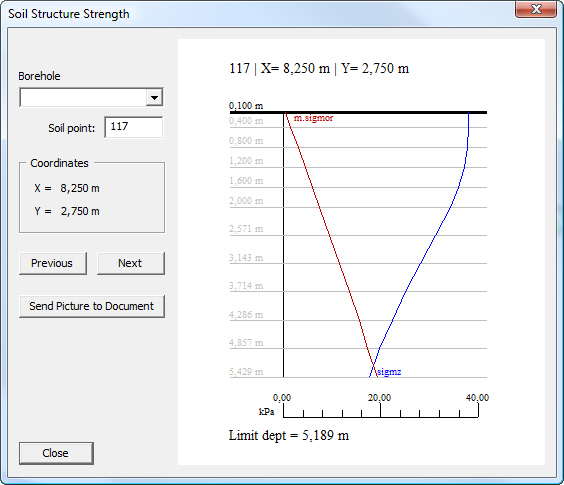
The Soilin module calculates two stresses: the overstress Sigma,z and the original soil stress Sigma,or. According to theory, settlement will occur if Sigma,z > m * Sigma,or.
The m-value is code dependent: (i) for the CSN code it can vary, for EC & DIN it is fixed at 0,2. It practically means that settlement occurs in case the overstress is bigger than 20% of the original soil stress.
The picture shows these two lines: Sigma,z in blue and m * Sigma,or in brown. The program is looking for the intersection of the two lines: all layers above have Sigma,z > m * Sigma,or and settlement occurs in them and all the layers below have Sigma,z < m * Sigma,or, which means that no settlement is there. The depth at which the lines intersect is called the "limit depth"
In case the user has not input a sufficient geological profile i.e. not deep enough, the intersection point cannot be determined. It means that the calculated settlement will be too small since there are still deeper layers which will also be compressed and will thus settle. Therefore, the program gives a warning that the geology is "Insufficient".