Dynamics detailed (results for dynamic analyses)
Since SCIA Engineer v 25, there is a result command, which enables detailed results for all kinds of dynamic analyses (modal, seismic, harmonic), and it is called "dynamics detailed".
General information
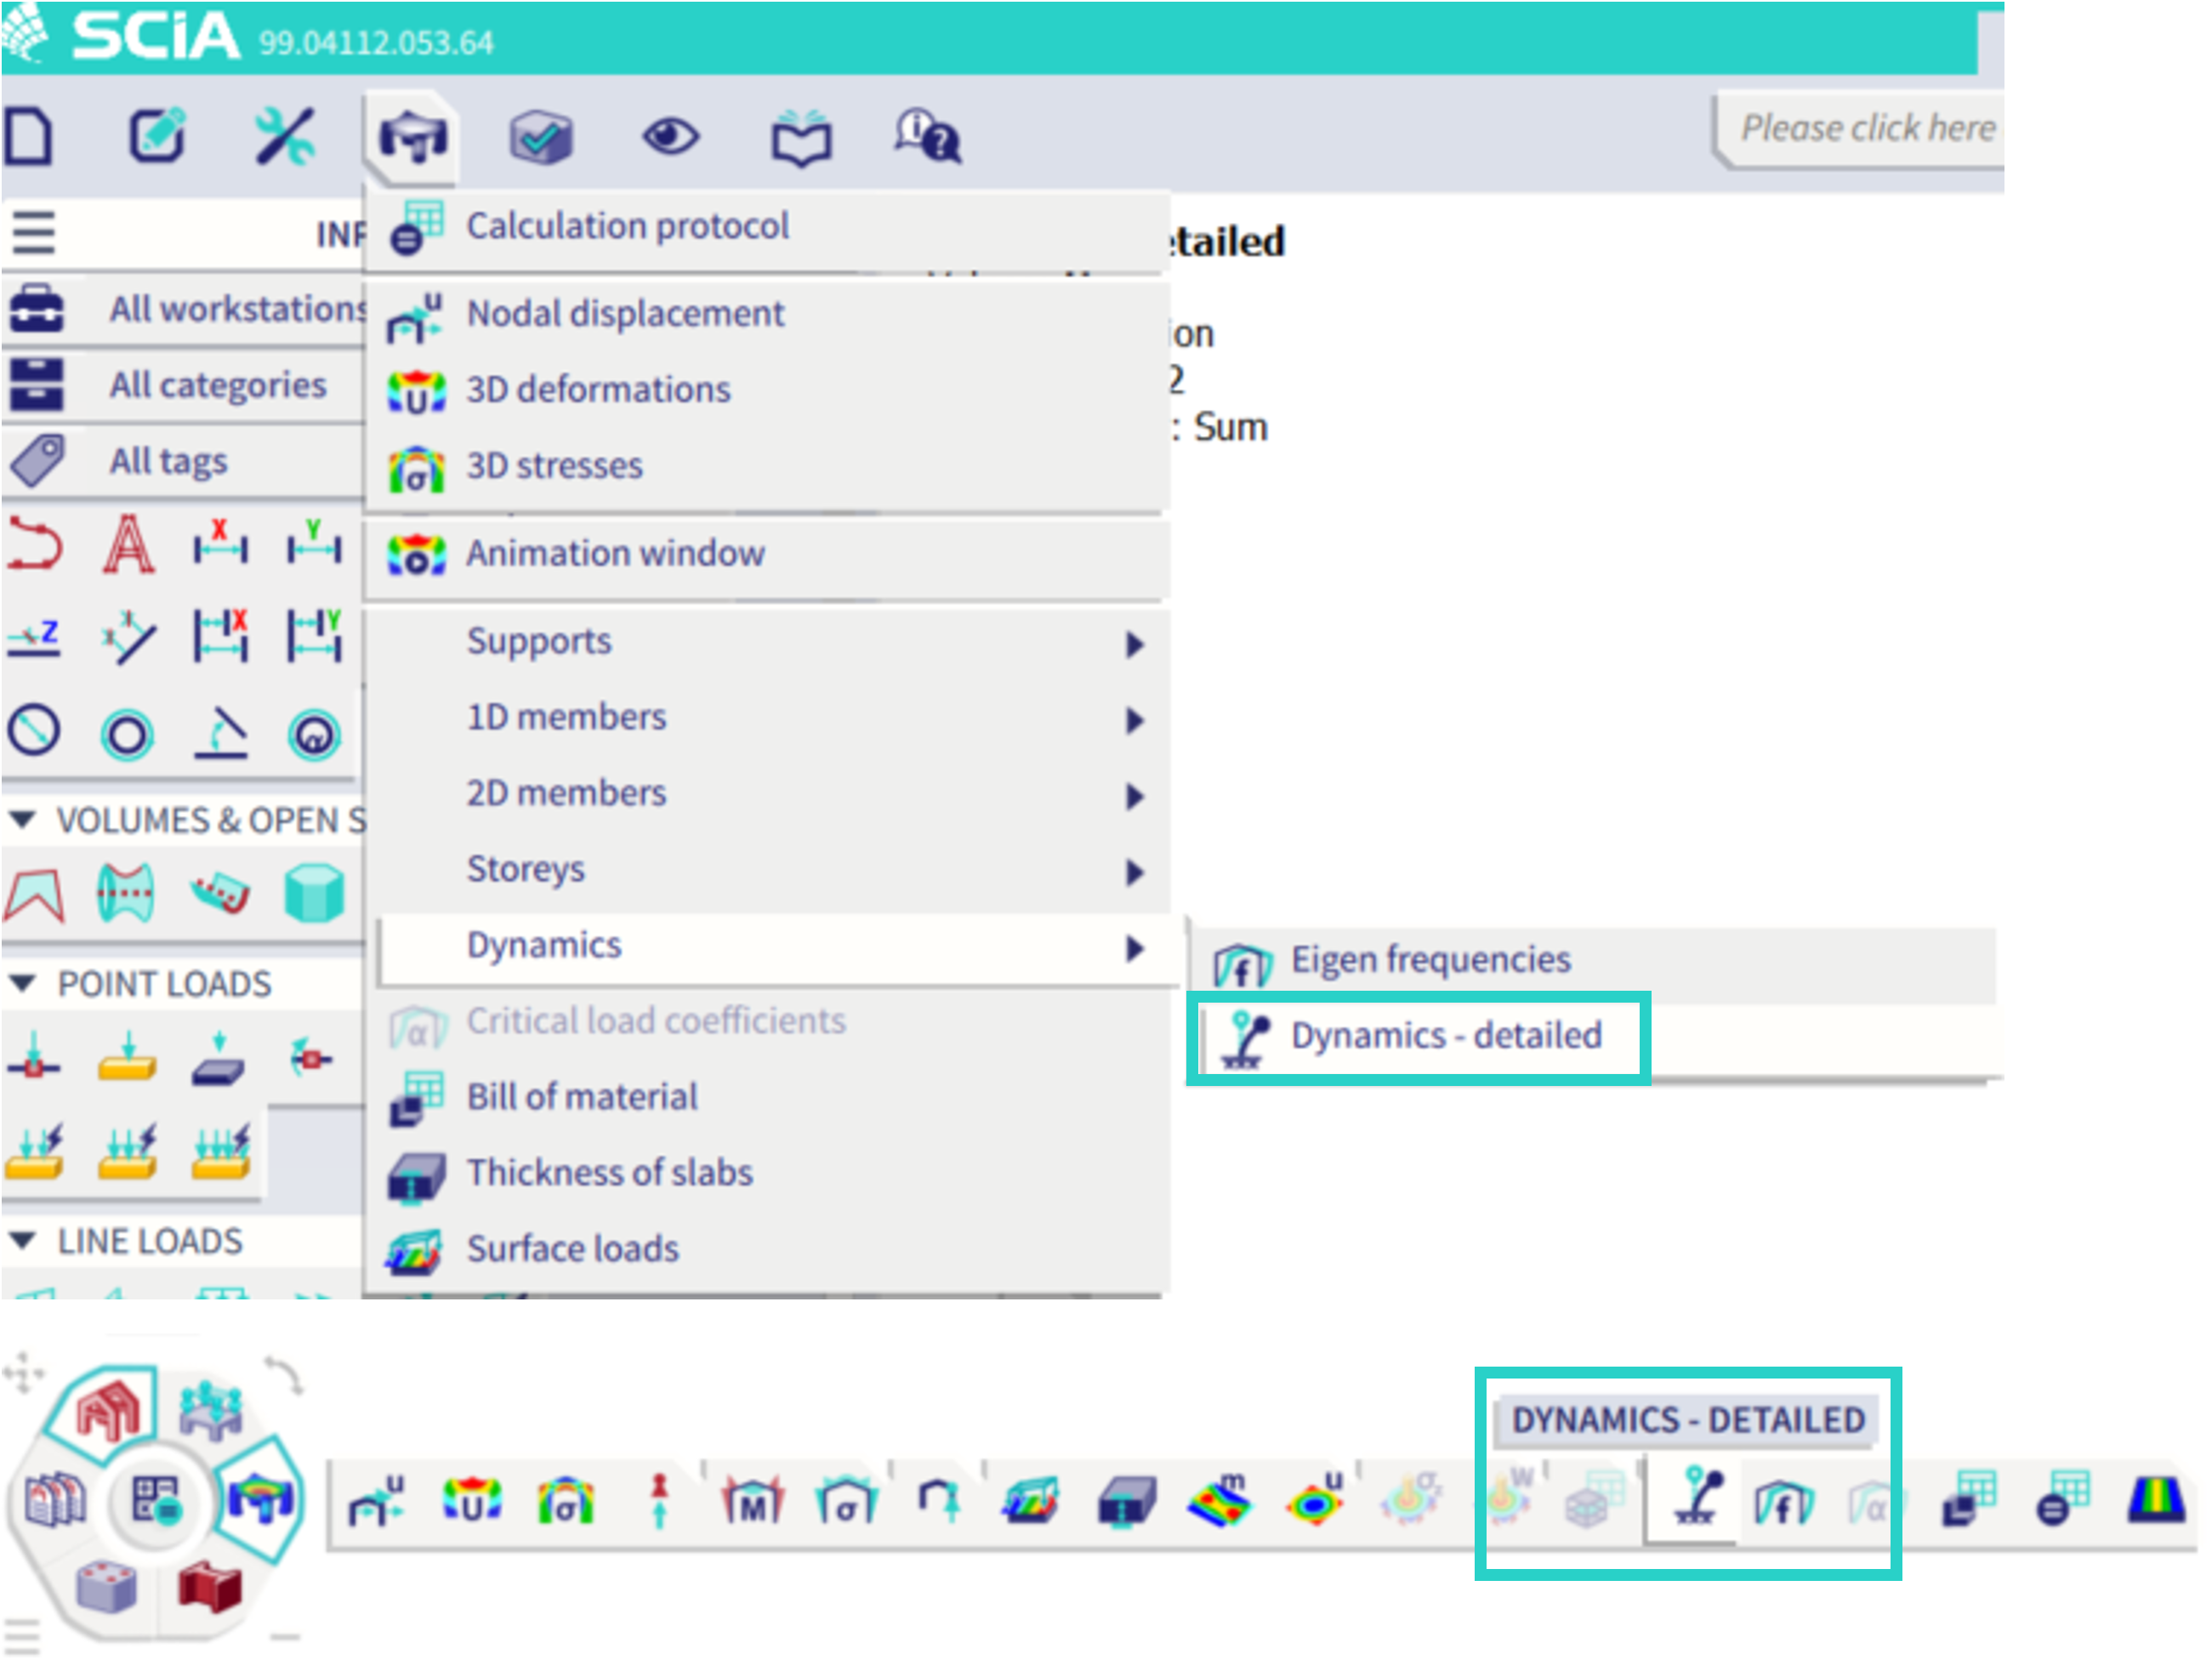
The command icon is depicted in the figure below. It is accessible in: "Results" → "Dynamics" → "Dynamics - detailed"; or by default also in the process tool bar in the "results" part.
Some dynamic analysis is required to be calculated in order to use this command (either modal, seismic or harmonic analysis).
The properties of this command depends on the selected "type of load" and corresponding analysis. Three options are available:
A) Detailed results for seismic load case - hence the property "Type of load" = "load cases" ; and "load case" = "some calculated seismic load case"
B) Detailed results for harmonic analysis load case- hence the property "Type of load" = "load cases" ; and "load case" = "some calculated harmonic load case"
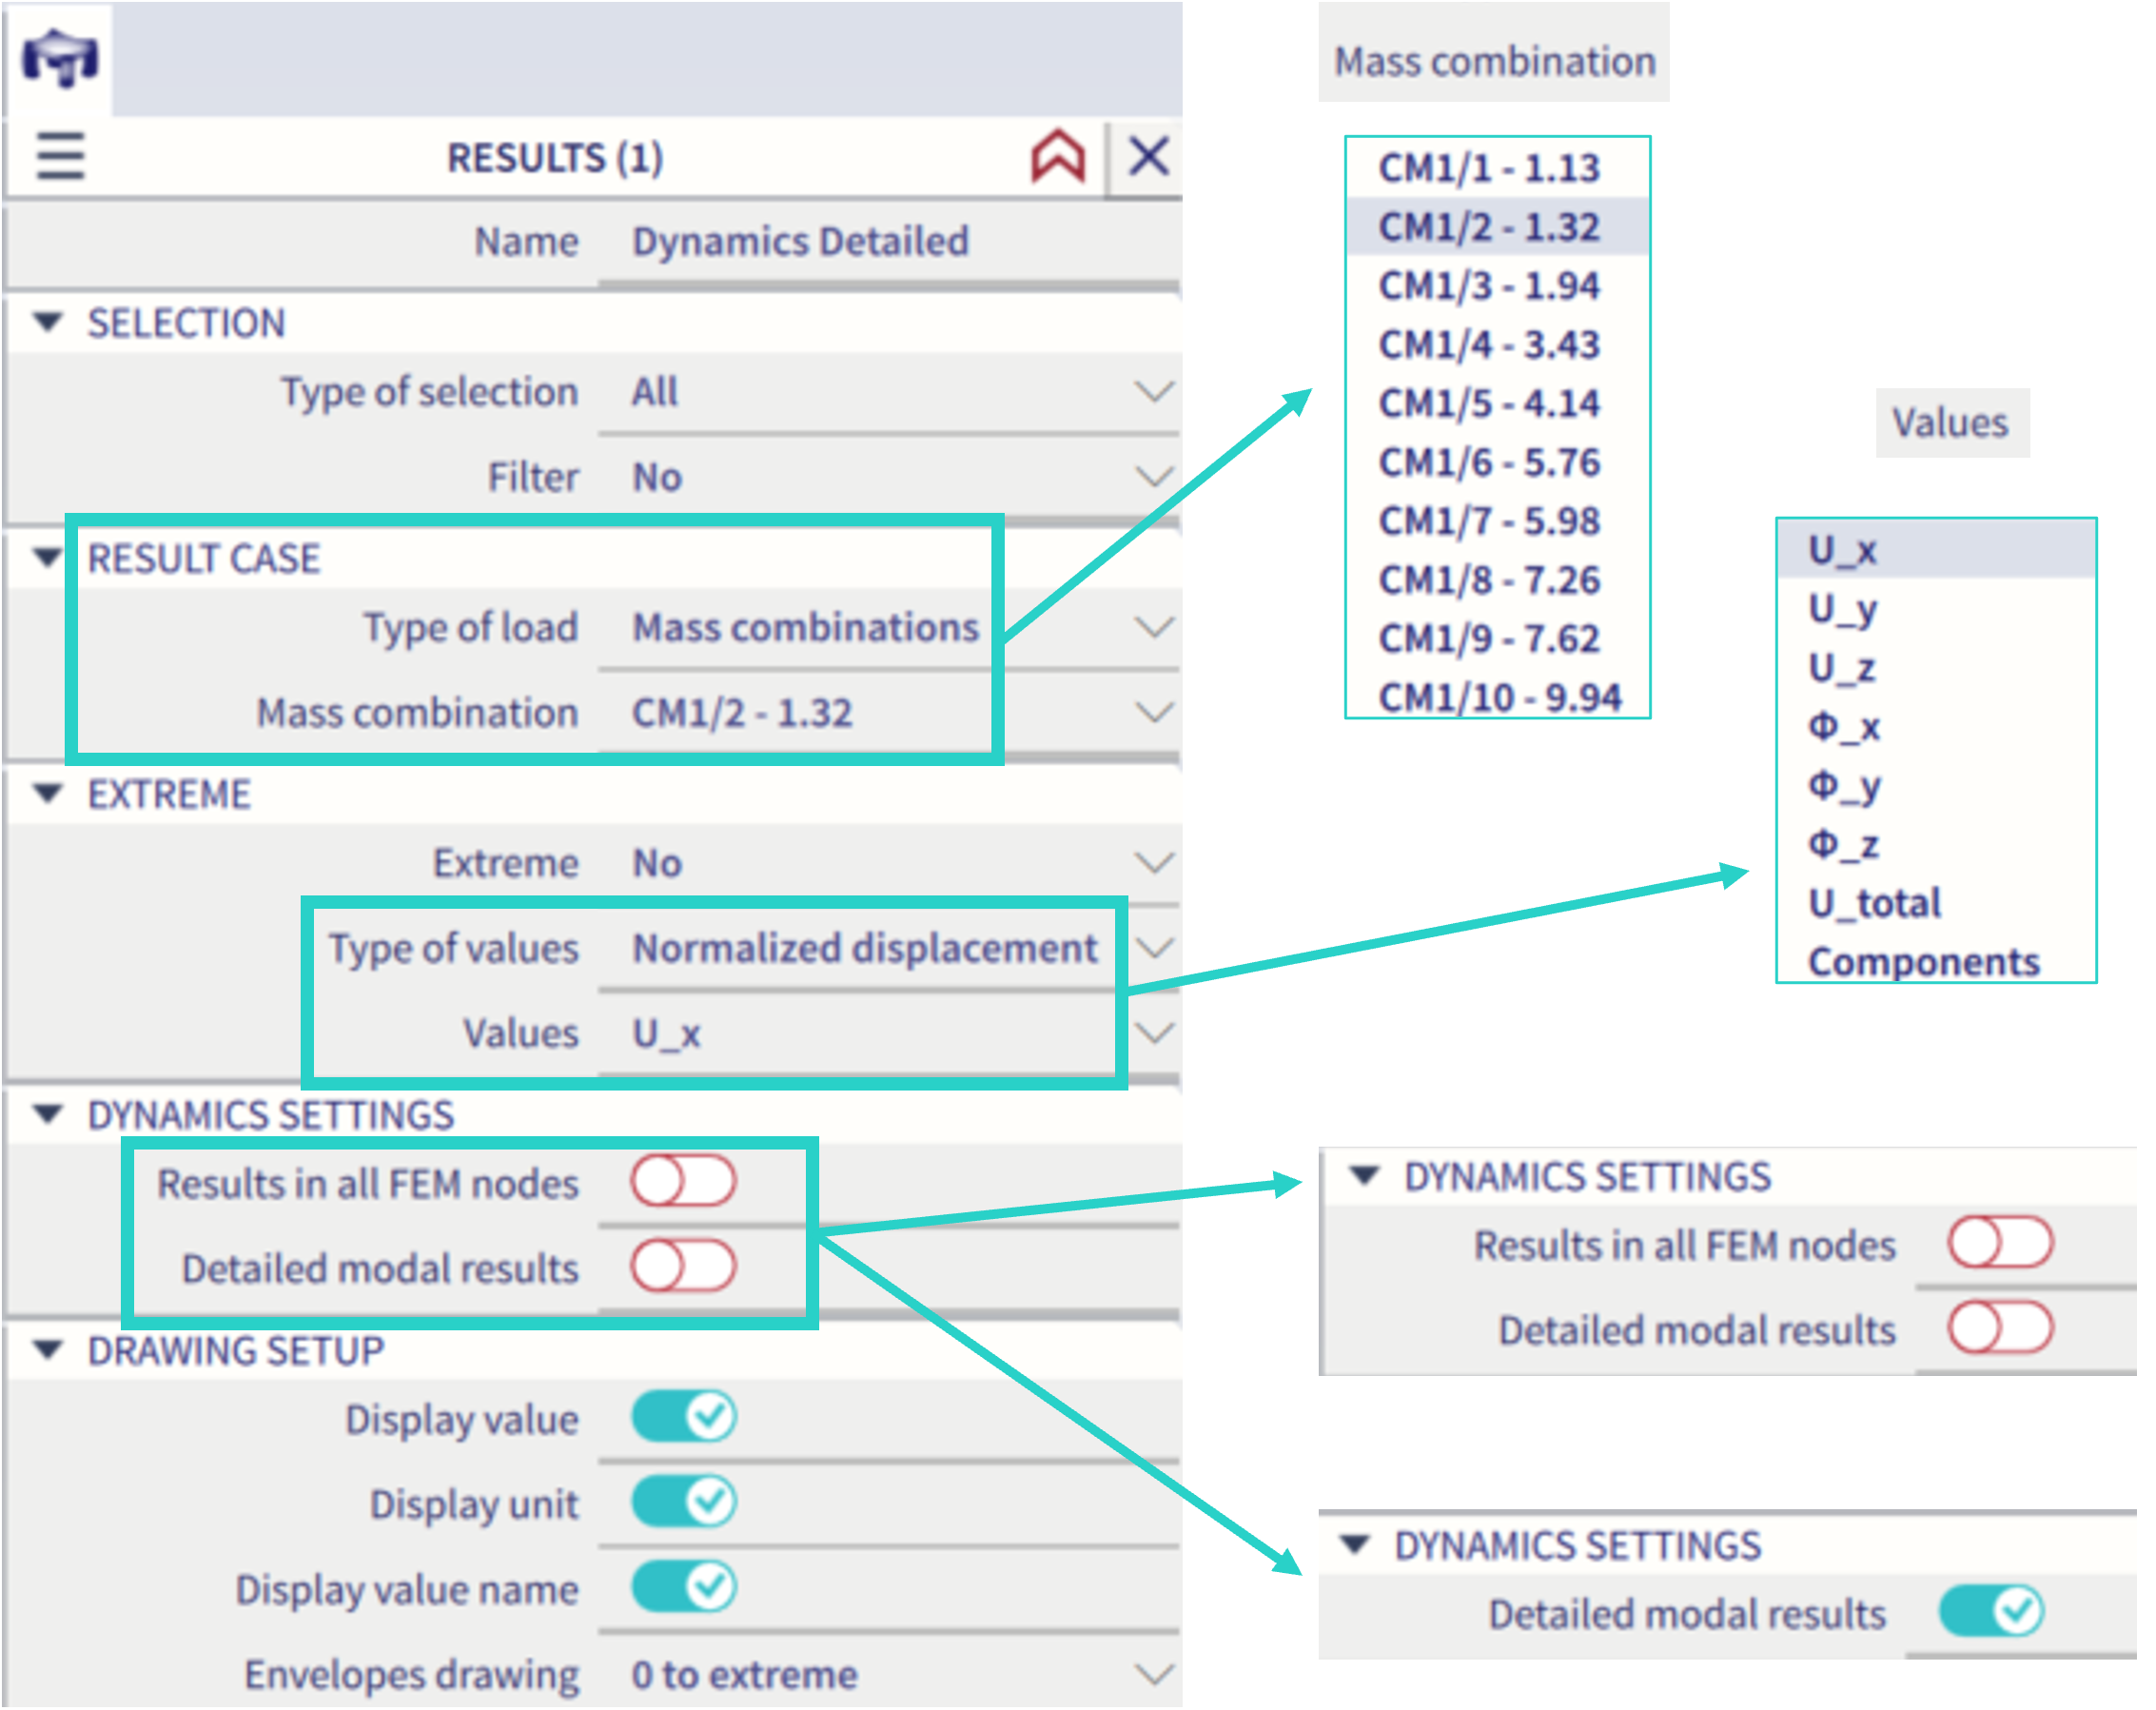
C) Detailed results of modal analysis eigenshape - hence the property "Type of load" = "mass combination" ; and "mass combination" = "some calculated combination of mass group along with the selected eigenvalue"
These possibilities are summarized in the figure below, and will be further explained in the following chapters.

A) Dynamics detailed - seismic load case
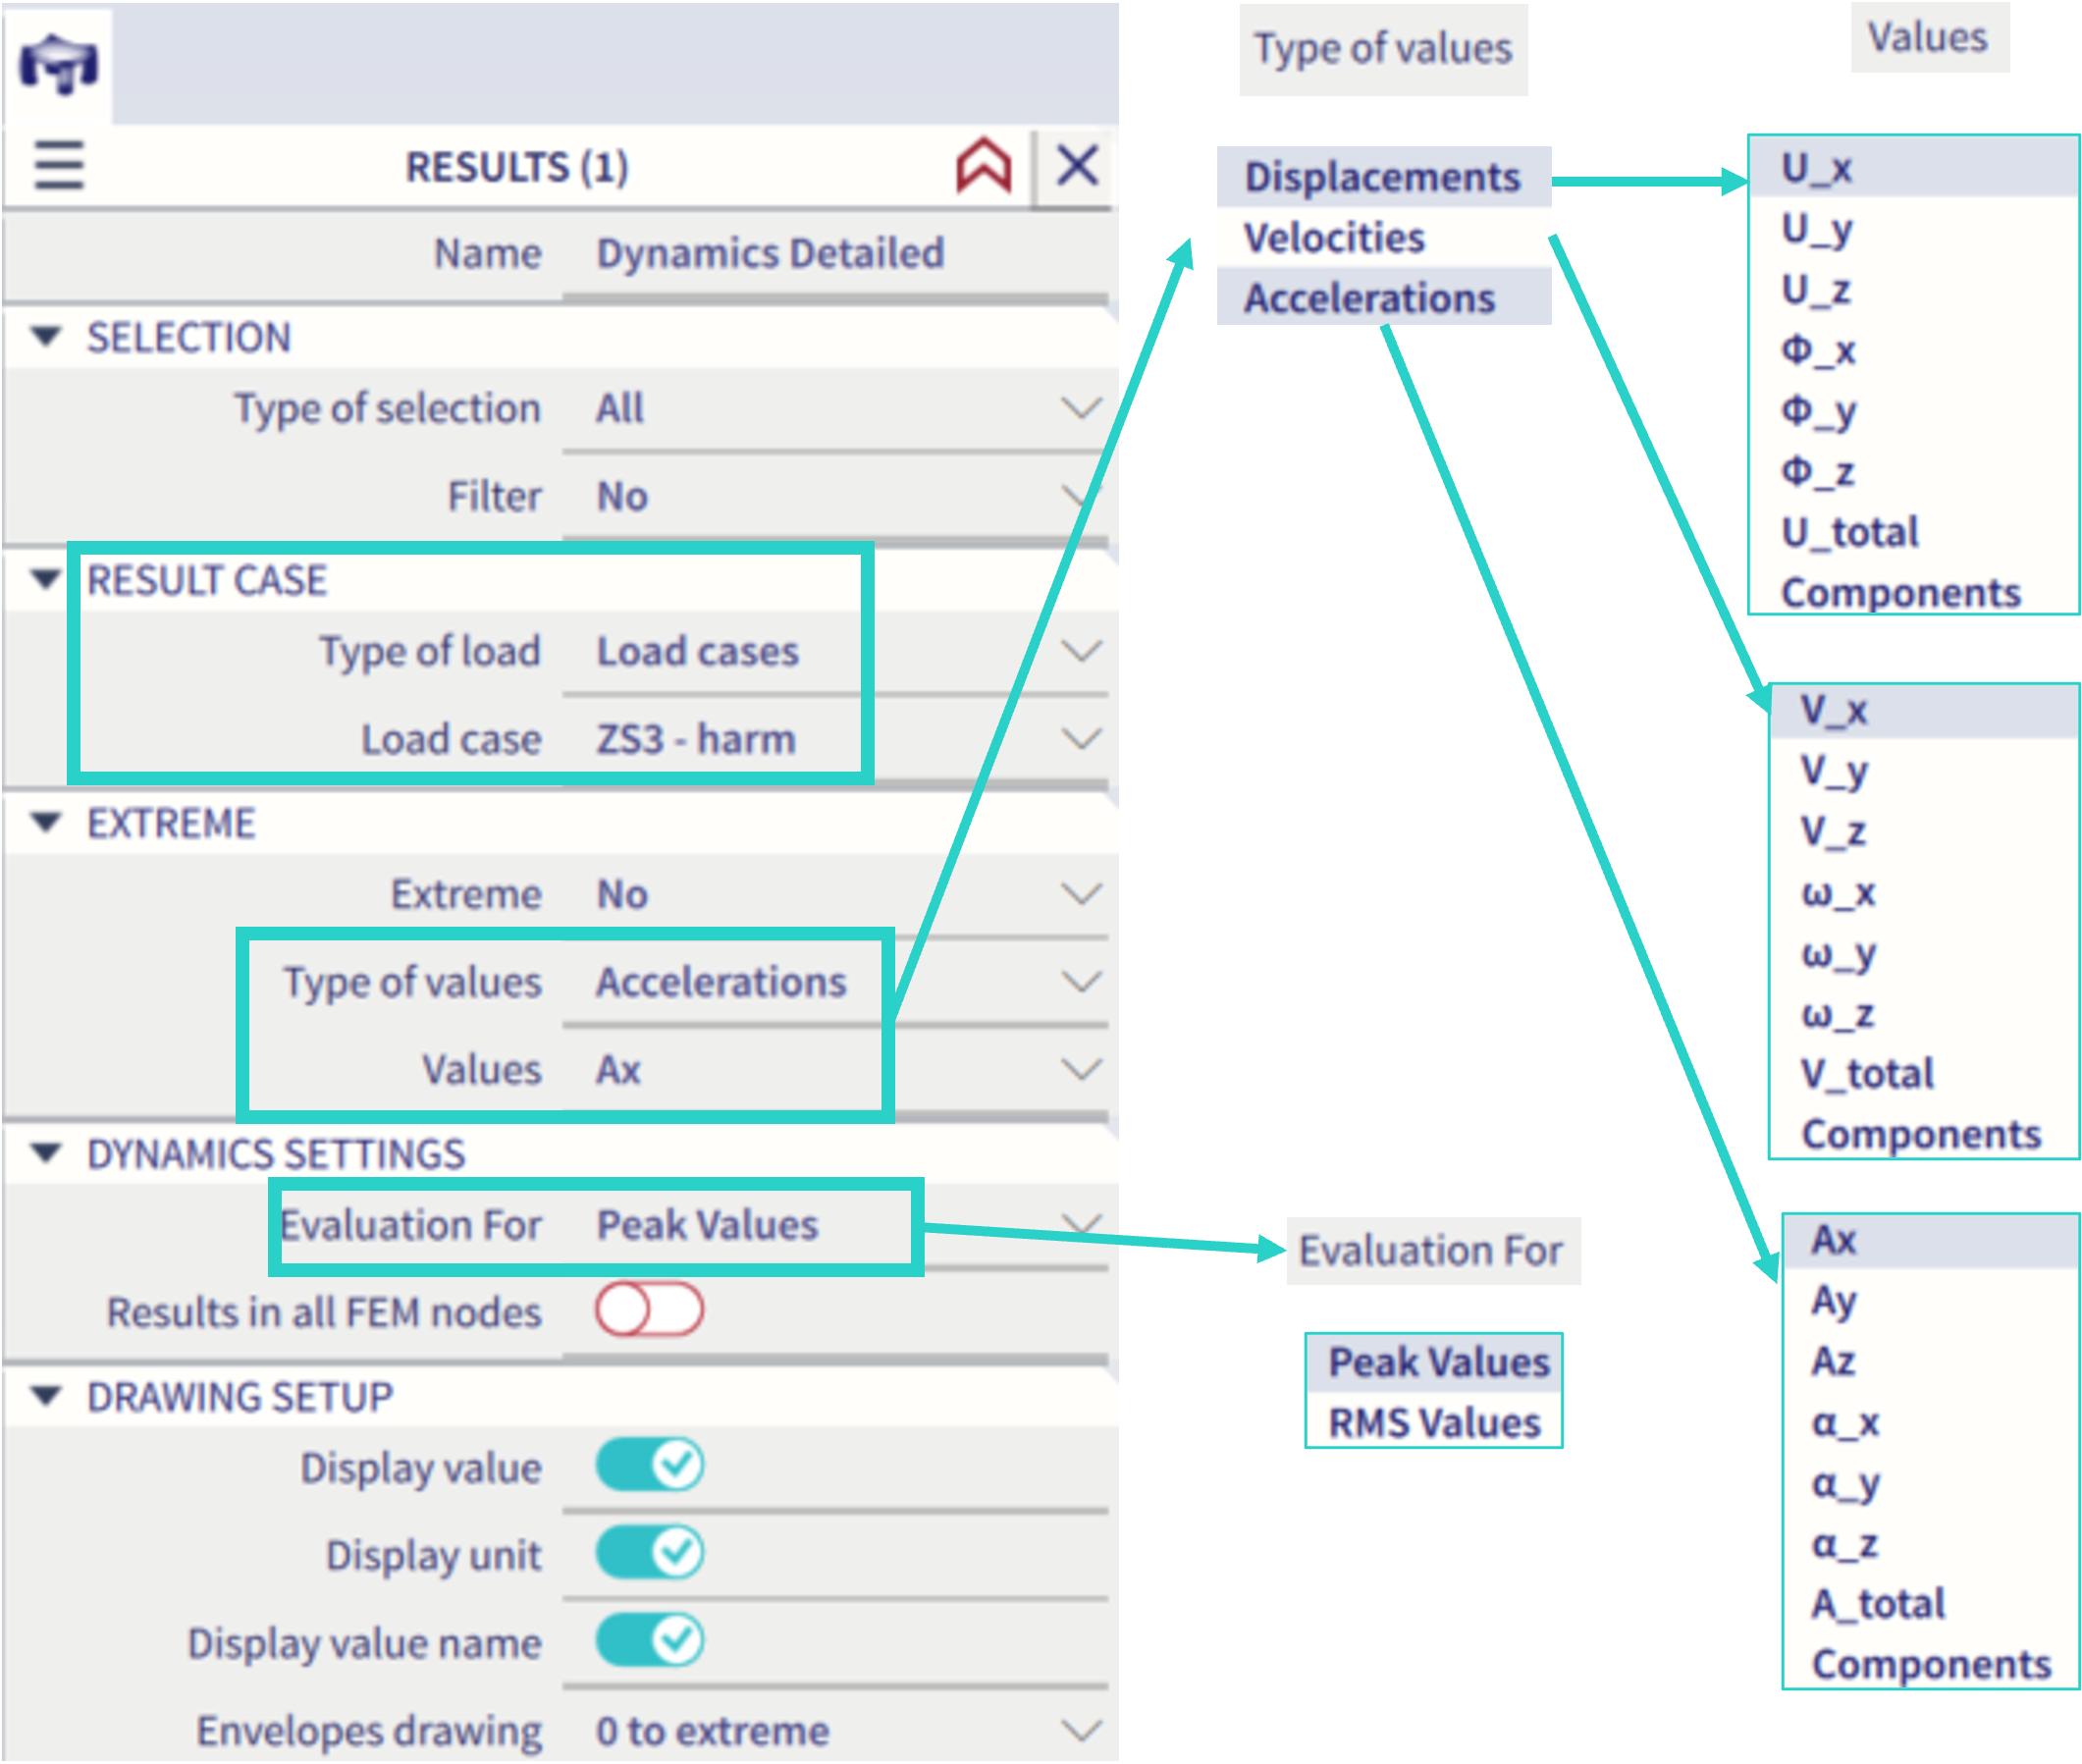
For seismic load case results, the "type of values" might be selected as "displacement", "velocities" and "accelerations". For each type of value, the corresponding values of translational and rotational motion might be selected, as well as the total value (the vector sum) and more components (multiple values to be displayed at once). See in the figure below.
The "Evaluation for" property might be set to "sum" - in this case the values based on all the eigenmodes are summarized in accordance with the selected summation rule of the corresponding seismic load case (the "type of superposition" property, which might be set to "SRSS" or "CQC" within the corresponding load case properties). Alternatively, the results might be evaluated only for single selected eigenmode of the corresponding modal analysis (see example in the figure below - in this case only 10 eigenmodes have been calculated, which will not be sufficient for most of the structures).

The check box property "Result in all FEM nodes" offers to plot the result in all the nodes of the finite element mesh (example provided in the figure below). If the mesh is fine, this might be graphically in 3D scene rather unreadable. However, the export into excel sheet from the "result table" might have some practical application in order to see the results in all the mesh nodes.

B) Dynamics detailed - harmonic analysis load case
The properties are almost identical to the previous case A (detailed result of seismic load case), the only difference is, that there are only two options for the property "Evaluation for":
"Peak values" - the maximal values from the harmonic response of the structure (sinusoid) are displayed
"RMS values" - where "RMS" stands for "root mean square" - as the harmonic response is considered to be sinusoidal, the root mean square is practically multiplying the maximal peak value by the constant value of 0.707107 (what is √2 / 2).
C) Dynamics detailed - modal analysis
Results for all eigenmodes are available to be plotted.
When plotting the results of modal analysis, there is only one option for the "type of values" property, which is "normalized displacements". The corresponding values are then 3 translations and 3 rotations, with option to plot total value (vector sum), or also more components.
Detailed modal table
In this case (dynamic detailed results for modal analysis), there is a special check box named "Detailed modal results". If this is activated, the check box "Result in all FEM nodes" is not available (in order to limit the size of the subsequent result table).
This check box "Detailed modal results" has no influence on the results plotted in the 3D scene. It enhances the "table results", providing more data in one large table. An example of such table is provided in the figure below.

This table summarizes following results for each node (2nd column) of the structure and each calculated mode (3rd column). Note: in some cases the results might be the same no matter for which node these are provided, as the results depends on the whole structure
Frequency f [Hz] (4th column) → eigenfrequency corresponding to the specific mode shape; (note: not depending on the node)
Period T[s] (5th column) → T = 1/f ; (note: not depending on the node)
Cumulative masses in all three directions, mx, my and mz [%] (6th - 8th column)→ cumulatively calculated corresponding modal masses (9th - 11th column) (note: not depending on the node)
Modal masses in all three directions, mx, my and mz [%] (9th - 11th column) → moving mass for the corresponding eigenmode (note: not depending on the node)
Total masses in all three directions, mx, my and mz [kg] (12th - 14th column) → total mass of the structure in the corresponding direction (note: not depending on the node, neither eigenmode)
Nodal masses in all three directions, mx, my and mz [kg] (15th - 17th column) → mass localized in the single finite element node which is located the closest to the corresponding node (an example will be provided further below) - this value is dependent on mesh size and shape - in general the value might be different for each node. The value will be the same for one specific node and different eigenmodes.
Eigenvector in all three directions, Ux, Uy and Uz [mm] (18th - 20th column) → for each node and the corresponding eigenmode, the coordinates of eigenvector are provided (in general different results in each row of the table)
Participation factor in all three directions, x, y and z [unit less] (21st - 23rd column)
Example of nodal mass values
In order to explain these values, the modal analysis has been conducted using the following structure (see the figure below)

Three mass groups (MG) have been defined: MG1 (local mass of 1000 kg in the node N2), MG2 (based on self-weight) and MG3 (line mass on horizontal beam of 100 kg/m). All these masses are acting in all directions (x, y and z) with factor 1. One combination of these mass groups has been analysed: CM1 = 1*MG1 + 1*MG2 + 1*MG3, asking for one eigenmode.
In the first analysis (see the figure below) one finite element per each 1D member has been considered. It is visible, that at the position of the node N3, there are 2 finite element nodes, node number 3 and 5 (in order to see the finite element mesh, activate the corresponding check boxes in the "view parameters setting"). When the "detailed modal results" are plotted in the table, the masses of each node N1 - N4 are provided in the corresponding column. When these masses are summarized, the value is 3717 kg, however the total mass of the whole structure is 4160.7 kg. The mass of the finite element node number 5 is not included in the detailed modal table.
Conclusion 1: if there are multiple FEM nodes at the location of the "SCIA" node (e.g. in case of hinges), the nodal mass for that corresponding "SCIA" node is taken from one of these FEM nodes (in the example below, nodal mass for N3 is taken from FEM node number 3, not considering the mass in node number 5).

In the second analysis, two finite elements per each 1D member has been considered. In this case, the summed nodal mass from the detailed modal table has decreased, because the mass of those FEM nodes which are located at positions where no "SCIA" nodes are present (FEM nodes numbers 6, 7 and 8) is also not included.
Conclusion 2: the value of the nodal mass is dependent on finite element mesh. The finer the mesh, the smaller the nodal masses.

Please keep this behaviour in mind when evaluating the nodal mass results.
Units
In order to change the units of accelerations or velocities: "Unit system" → "Manage units" → "Dynamics" → and the corresponding entities - see the figure below:
