Introduction
Capacity - diagram services uses creation of interaction diagram which is a graph illustrating the capacity of concrete member to resist a set of combinations of axial force and bending moment. Dependent on the load, the position of the neutral axis is changed and this leads to obtaining different values of compressive and tensile areas in concrete members. Therefore this concludes to a different capacity calculated from the strain distribution.
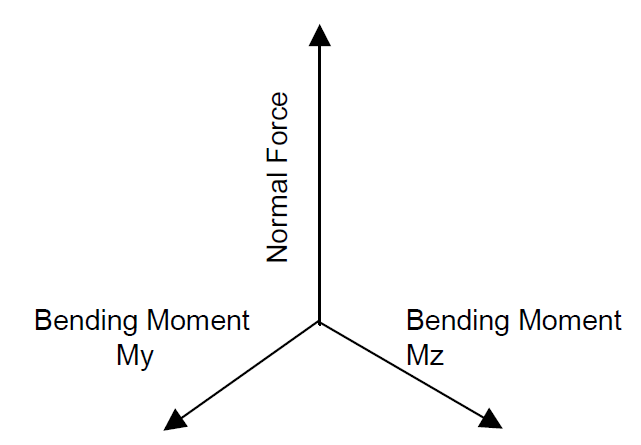
The Capacity - diagram calculates the extreme allowable interaction between the normal force N and bending moments My and Mz. In theory this diagram is a 3D-diagram, but SCIA Engineer allows the user to obtain horizontal and vertical sections. The axis of the diagram has an axis for the normal force N, the bending moment My and the bending moment Mz.