![]()
|
||
|
|
||
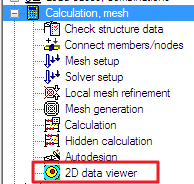
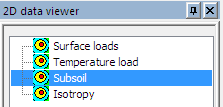
The soil-in results are available in two different services. In the “Calculation, mesh” service is 2D data viewer. There are results for Subsoil.
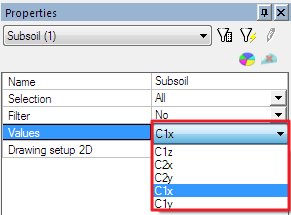
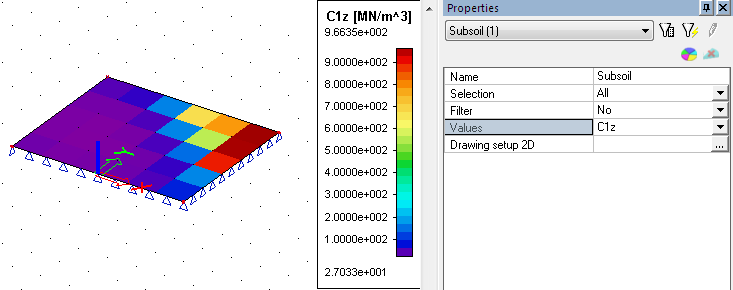
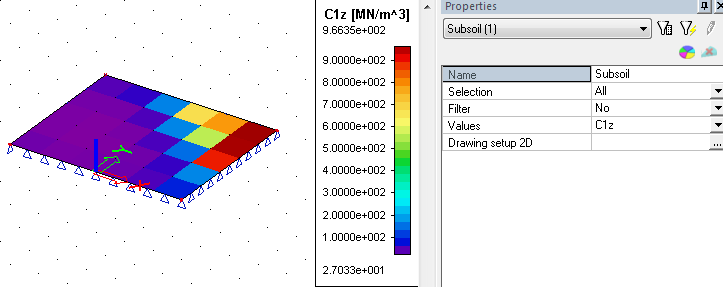
The C parameters are calculated for the mesh on the 2D member. It is displayed by the colour planes.
The results can be displayed for each of C parameters.
The example of calculated C1z:
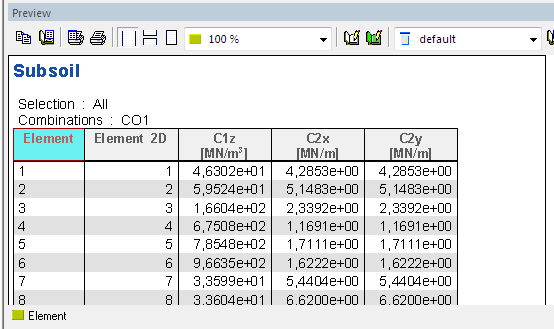
The preview with C parameters in the table can be also displayed in the 2D data viewer.
The service results contain two result previews:
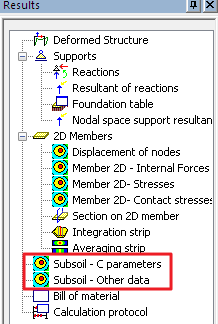
When the Soilin type of the support is used then the preview Subsoil – C parameters displays the same results as 2D data viewer.
When the Both type of the support is used then the preview Subsoil – C parameters displays results of the soilin calculation and the 2D data viewer display data from the Subsoil library.
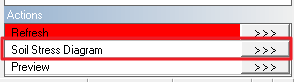
The “Subsoil – Other data” allow to display Soil structure strength diagram for calculated points. The points are displayed by the action button “Soil stress diagram”.
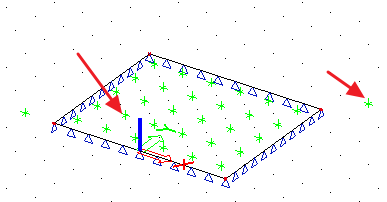
Green vertexes on the plate are centres of elements from 2D mesh. Two green vertexes outside the plate are inserting points from boreholes.
Points are displayed as a green vertex. The vertical axial components of stress and the structure strength (consequently the depth of the deformed subsoil zone) can be displayed for all points from the 2D mesh and for the inserting points of the boreholes. User just selects the point and the diagram is displayed.
If the borehole is defined as “Results only”, then the point is available for displaying the diagram.
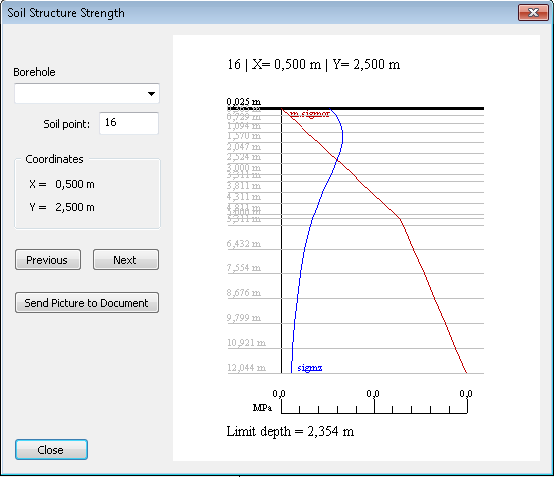
Example of the dialogue Soil Structure Strength:
Previous:
Display the Soil Structure Strength for the previous node
Next:
Display the Soil Structure Strength for the next node
Borehole:
Display the Soil Structure Strength for the selected borehole inserting point
Soil point:
Node number
m*Sigma,or:
The original soil stress
Sigma,z:
The overstress
See more about Soil Structure Strength diagram here.
There are two lines - m*Sigma,or and Sigma,z. According to theory, settlement will occur if Sigma,z > m * Sigma,or.
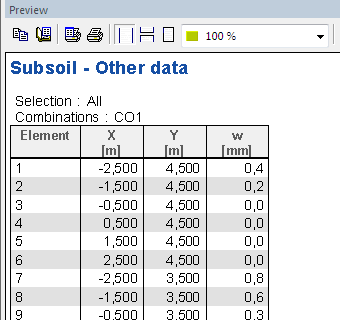
The table is displayed in the Subsoil – other data results. The preview table contain values w for each node.
The settlement w is different from displacement uz of the foundation plate because w is calculated without stiffness of structure and from the penultimate iteration. Therefore it is useful to watch values w only outside the foundation.
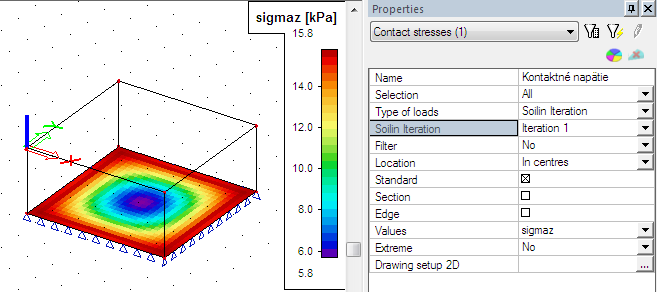
When the soil-in won’t finish its iteration process in a standard way, the calculation ends after the predefined number of cycles (the solver setup). User can display the contact stresses on the plate for each cycle separately so he is able to find the problem.
The calculated contact stresses for each iteration cycle can be found in the results.
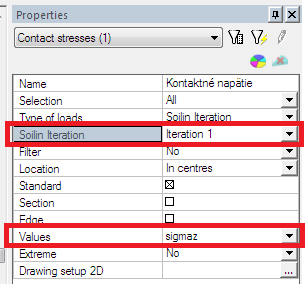
The first iteration cycle
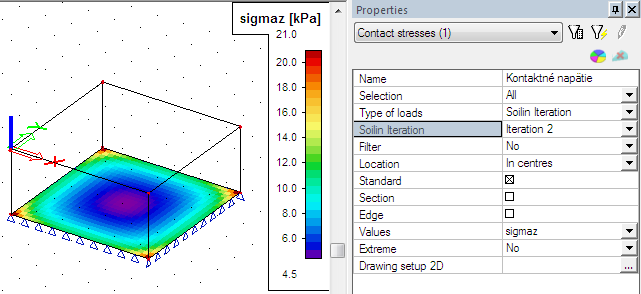
The second iteration cycle
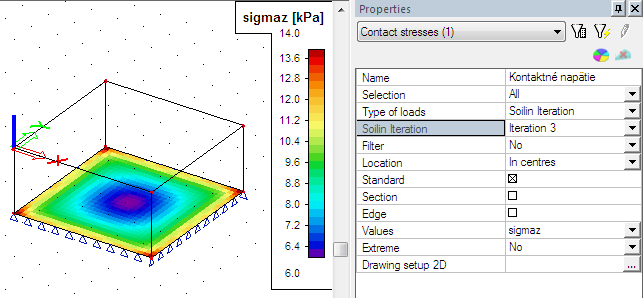
The third iteration cycle
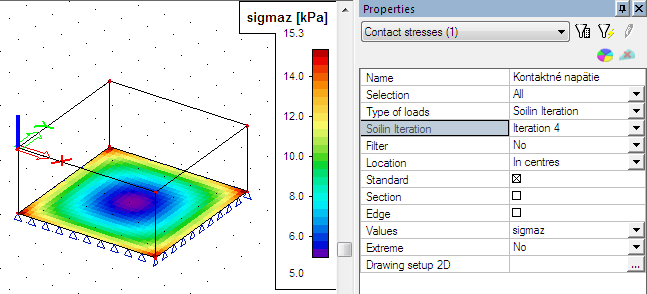
The fourth iteration cycle
The additional springs are automatically added on the edges if soilin calculation doesn’t recognize additional plates around the support. See chapter Advanced tips.