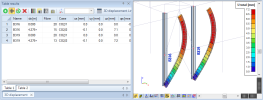
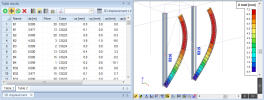
Table results - table
The functionalities of table in the Table results are similar to Table input. If you are a familiar with the Table input functionality it will be easy to use the Table results as well.
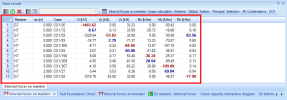
Table contains numerical results and consists of rows and columns. Columns represents the type of results and the row represents the geometrical position of result on the structure and combination key.
Sorting
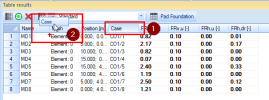
Clicking on the column's header user can define the ascending/descending sorting of table. The small arrow in the header specifies whether the table is sorted ascending or descending.
- The first click sorts the column from the top to the bottom.

- The second click sorts the column from the bottom to the top.
- The third click clears the sorting and default order of rows is displayed.
Filtering row
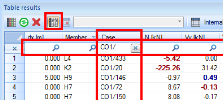
Filtering row allows user to filter the content of table according to specified criterion in particular columns.
Filtering row can be activated using appropriate button "Filtering row".
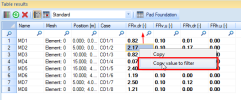
Value in the grid can be easily inserted into Filtering row using the context menu of selected cell.
There are 3 modes of filtering:
simple comparison
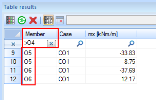
Table displays only rows which have in the selected column value which contain value entered in Filtering row. See following example:
"<" and ">" for numerical values
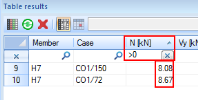
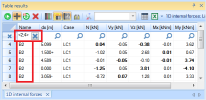
Table displays only rows which have in the selected column value 'bigger than...' or 'lower than...' specified value. See following example:
"<" and ">" for text values
Table displays only rows which have in the selected column value 'bigger than...' or 'lower than...' specified string value. The advanced logic can also handle the naming system often used in civil engineering (e.g. naming of columns - first symbol (letter) according to x line-grid axis, the second symbol (number) according to y line-grid axis). See following examples:
Filter by open interval "(XXX;YYY)"
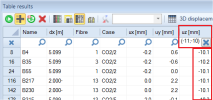
The table displays only those rows that have in the selected column value 'bigger than XXX' and 'lower than YYY', where 'XXX' and 'YYY' can be either a number or a string.
Filter by closed interval "<XXX;YYY>"
The table displays only rows that have in the selected column value 'bigger or equal to XXX' and 'lower or equal to YYY', where 'XXX' and 'YYY' can be a numerical or string value. The sorting by closed interval is best to be used for discrete and round values, such as names of entities or sections.
Activity filter in Table results
The activity in the 3D window is controlled by Activity tools. The same activity can be used in the Table results. It is managed by the button next to the filters on the toolbar.

This button allows for filtering of the content according to the current activity in the 3D window. The default status is ON.
If the Activity in Table results is ON while generating the results, only the results (and checks) for the active members are evaluated. For large projects with a huge number of entities this presents a significant saving of time that is needed to generate a new tab in Table results.
When the is turned OFF on a tab that was generated with set to ON, no additional results will be displayed:
The filter was applied before the results and checks were calculated and no further results are available in this tab. To display results for another activity, click the action button. This action will generate a new tab and the current activity will be respected.
If the Activity in Table results is set OFF while generating results, then results on all members in the project are displayed in the Table results:
The may be turned ON in already generated tab. In this case the button works as a filter and will filter out results on inactive members. Only results on active members will be displayed:
However, in this case the button only works as a filter, results on all members in the project are still available when the filter is switched OFF again or when the activity changes.
Selection filter in Table results
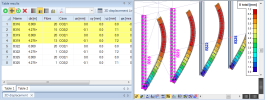
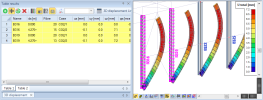
User selection in the 3D window is also displayed in the Table results using yellow highlighted rows. The selection can be used as a filer in the Table results. It is managed by the button next to the filters on the toolbar.

This button allows for filtering of the content according to the current selection in the 3D window. The default status is OFF.
When the is OFF, all available results are displayed in the Table results:
When the is ON, only results on selected members are displayed:
Copy values into clipboard
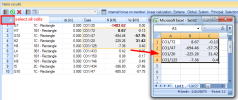
User can easily copy the content of selected cell range into clipboard and insert it into spreadsheet afterwards. The values in the selection will be copied together with the table header for clear overview of the values in the table.
- Select some cell range in the table.
- Copy values to the clipboard:
- using the context menu of selected cell area
- using the short-cut CTRL+C.
All cells can be selected by the top left cell (corner empty cell).
Columns manipulation
Columns layout
TLX type of results
The default order of the result is taken from the predefined files which are used in the Engineering Report (TLX files).
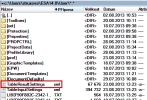
When the order or the width of columns is changed, the file with a new layout is saved. The last setting is used when the same result type is displayed again. The file is stored in the User folder as TableResultSettings.xml - see the "Directories settings" chapter.
If the XML is deleted, the layout is generated again according to the default TLX file.
The Reset GUI option may be used for the loading the default layout to the Table results and Table input. See the "Environment settings" chapter.
IPfile type of results
The grid layout is not saved for this type of results. Instead of that there is the automatic width of column prediction that sets the sufficient width for particular columns. User can adjust the widths afterwards but this is not saved and after switching to another tab the changes are lost and than the default automatically predicted widths are restored to calculated value.
Column selector
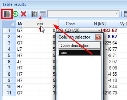
Column selector contains the list of hidden columns.
The default order and visibility of columns is defined in the TLX file that is loaded when results are loaded into Table results. When user make some change in order or visibility, it is saved to a special file and used when this type of result is displayed again later.
The column selector may be displayed:
- using the button on the toolbar (see "Table results - toolbar description" chapter)
- using the context menu on the column header (see "Header context menu" chapter)
How to add a hidden column to the table:
Hiding of columns
Column can be hidden by:
Empty columns are hidden by default.
Order of columns
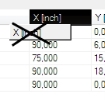
Order of columns can be easily adjusted using the drag and drop method:
Modify the width of the particular column
The column can be resized :
- using the "Header context menu"
Highlight of extreme values
Values which are extreme for particular magnitude and member are highlighted by bold font:
Selection link
For some types of results the 'selection link' between the Table results and model is available. This link works in both directions:
- members selected in the model are selected in Table results as well
- members selected in Table results are selected in the model as well
Selection from Table result is initiated by mouse click on the header of the row (index number) - see attached picture.
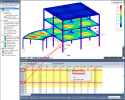
Every row in Table results presents results for some geometrical position in the structure for some load case. In general, results for one member (beam, slab, ...) are represented by many rows in Table results. This functionality causes that all rows related to members selected in the model are highlighted by yellow colour in Table results. And vice versa - selection of one row (using click on the header of the row) causes selection of related member in the model which causes the highlight of all rows related to this member in Table results.
User can use also multi-selection using CTRL and SHIFT keys.
All members selected /highlighted on current tab can be unselected using the ESC key.
Tip&Trick: It is very effective to use the "Zoom to selection" button together with selection link in Table results. Imagine that you have large and complicated project and you're listing through the table with results and you see some interesting value on member. But you don't know where exactly this model is on the graphical presentation of the complicated and large model. Just select the row (by clicking on the header of the row) and use "Zoom to selection" (toolbar "Selection of objects"). 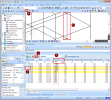
3D model position highlight
This functionality shows you the geometrical position that is related to the particular row in Table results.
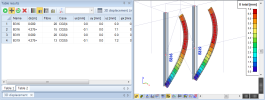
Basically, every row in Table results contains values that are valid for some geometrical position - for node in case of 0D results, for section in case of 1D results and for mesh-node in case of 2D results. When this functionality is used, the small symbol is placed in the 3D window showing the exact position for which is particular row valid.
You can also place multiple symbols using standard multi-selection ways (CTRL and SHIFT).
You can activate this functionality in several ways:
- clicking on the header of the row
- using the context menu
- double-clicking any cell
- pressing ENTER with any cell selected in the grid
So far, this functionality is supported only for new results:
- 0D / 1D / 2D SCIA Design Forms Open Checks
- Basic results: 3D stress, 3D displacement, etc.
- Concrete
- Composites
Tip: This functionality may be useful together with "Filtering row". You can filter the grid to get only some interesting values (e.g. places where the tension occurs - N > 0 or σ > 0), place the symbol to all filtered rows and this way you can visualize all those interesting places in the model.
Tip: The colour of the symbol is bound to the colour of structural nodes. This colour can be changed in Palette settings (Setup -> Colours/Lines).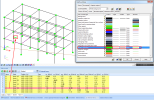
Display detailed check of row in preview
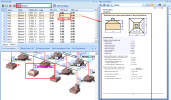
For open-checks using Design Forms technology results, it is possible to execute the detailed check for picked row using the double-click on the cell or using the ENTER or using the button "Display detailed check of row in preview" on toolbar.
Every row in Table results shows results for some geometrical position (0D nodes, section on 1D members, mesh node on 2D member) and some load case / combikey. Using this functionality user is able to execute detailed check for any member for any load case / combikey. The detailed output is displayed in preview window
Once the detailed output is displayed in the preview, it can also be sent to Engineering Report using the context menu in the 3D window. But be careful, this functionality is not intended to be used in this way and therefore the reference between the model and the detailed output from Table results is held to the row index number in the parental brief table of related check - see following warning for detailed description.
Although every row in Table results represents some geometrical position in the model, the reference between the detailed output from Table results and the parental brief table is based on the row index number. It means that if you send the Detailed output to Engineering Report, the detailed output is not related to the geometrical position in the model but is related to the index number of row in the parental brief table of considered result / check in the actual model. Basically it means that if you make some change in project that causes reordering of rows in parental brief table (e.g. delete some member, change the mesh, change the number of sections or mesh-nodes or elements, change the load, change boundary conditions, etc.), the existing detailed outputs from Table results will be still linked to the row index number in parental table but this row might not be valid to original geometrical position and combikey any more. After refresh of detailed output from Table result in Engineering Report you might get values for another member, section, node and combikey. Using other words, if you create detailed output from Table results for the 1000th row and send it to Engineering Report, the detailed output shows the same values as the 1000th row in parental brief table. If you make some significant change, recalculate, and refresh the detailed output in Engineering Report, it still shows the same values as the 1000th row of parental brief table, but this row might represent another position in the model and combikey than before.
Header context menu
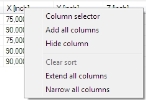
The rest of the tools are in the context menu opened by right-click on the column header:
- Column selector - display the list with available columns;
- Add all columns - add all columns available in the Column selector;
- Hide column - hide the particular column from the table and move them to the Column selector;
- Clear sort - sorting of table is cancelled;
- Extend all columns - the width of all columns is increased of 20 %;
- Narrow all columns - the width of all columns is decreased of 20 %;
Table context menu
This context menu is opened by right-click on the cell in the grid. It is dynamic and offers only features that are currently available in the grid:
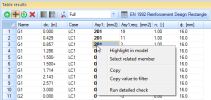
- Highlight in model - this command places the highlight symbol into the 3D window to show the position related to the particular value in the grid. See the "3D model position highlight" for more.
- Select related member - this command selects the member related to the particular value in the grid. See the "Selection link" for more.
- Copy - this item copy the values in the selected grid area into clipboard. See the "Copy values into clipboard" for more.
- Copy value to filter - this item shows the "Filtering row" and fill the selected values in.
- Run detailed check - this command executes the detailed check for selected cell in the grid. See the "Display detailed check of row in preview" for more.

