Adjusting the style of result diagrams
The style of the diagrams may be adjusted in the Drawing setup dialogue.
Representation
|
outline lines only |
|
|
outline lines only with hatches in sections |
|
|
filled form |
|
| Check-line | 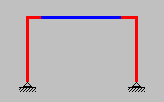
|
|
Check-max (the same as Check-line only the colour of the line is evaluated according to extreme value within the 1D member) |
|


Limits
The limits may be adjusted to control the colour of the diagram. The user specifies two numerical values. Three colours are used to display the diagram. The colours may be adjusted in the Setup > Colours and lines dialogue. Rules for use of individual colour are explained in the enclosed table:
|
Colour: Result if below min |
This colour is used for those sections where the value of displayed component is lower that the minimum limit. |
|
Colour: Result if above max |
This colour is used for those sections where the value of displayed component is greater that the maximum limit. |
|
Colour: Result if between min and max |
This colour is applied for the sections where the value of displayed component is between the limits. |
Example of limits application
Let’s assume the following adjustment of limits and colours:
|
Maximum |
1000 |
|
Minimum |
-4000 |
|
Colour: Result if below min |
blue |
|
Colour: Result if above max |
red |
|
Colour: Result if between min and max |
green |
The diagram will look like:

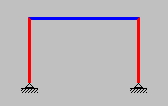
Another example
The settings described above may be used to "hide" specific range of the result values. For example, if you want to see just the positive branch of the diagram, it is possible to use the following trick.
|
Maximum |
0 |
|
Minimum |
0 |
|
Colour: Result if below min |
colour that is very close or identical to the background colour; e.g. very very light blue if white background is used |
|
Colour: Result if above max |
e.g. blue |
|
Colour: Result if between min and max |
does not matter |
The diagram will look like:

Description
Angle of text
The user may specify the inclination of the text for diagram labels.
Drawing of more components
If more than one component is drawn at the same time, it is possible to define the style of the composed diagram.
|
All the diagrams for the same 1D member use the same scale. |
|
|
Same height |
All the diagrams for the same 1D member use the same height. |
|
Space between diagrams |
Defines the "gap" between two adjacent diagrams. |
|
Shift of the first diagram |
Defines the shift of the first diagram from the 1D member. |