![]()
|
||
|
|
||
Since version 14.1 it is possible to display stresses also on surfaces of 2D members
Since version 15.3 it is possible to disable calculation of additional torsion effect from eccentric shear forces (see paragraph "Torsion from shear force eccentricity".
The new result 3D stress for checking stresses on the structure is available in version 14.
The major possibilities of this result are:
There are available three types of magnitudes:
| Magnitude | 1D members |
2D members |
|
Basic magnitudes |
||
| σx |
Normal - Normal + |
|
| σy(2D) | - |
|
| σxy(2D) | - |
|
| txy/txs(1D) | shear stresses in local coordinates (thick walled cross sections) or total shear flow (thin walled cross sections) | - |
| txz/txs(1D) | ||
| txz(2D) | - | Shear stress perpendicular to the plane |
| tyz(2D) | - | Shear stress perpendicular to the plane |
| Principal magnitudes | ||
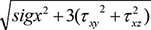
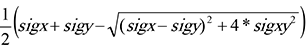
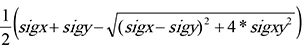
| σE |
Equivalent stress (von Misses)
|
Equivalent stress (von Misses)
|
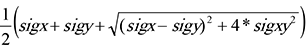
| σ1 | = σx |
Principal stress
|
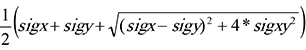
| σ2 | - |
Principal stress
|
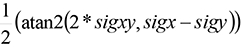
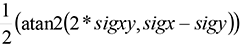
| α | - |
Angle of principal stress
(values displayed only in the table) |
|
txy/txs /tmax,b |
shear stresses in local coordinates (thick walled cross sections) or total shear flow (thin walled cross sections) |
Maximum shear stress perpendicular to the plane
|
|
txz/txs /tmax,b |
||
| Membrane magnitudes | ||
| σmE | - |
Membrane equivalent stress (Mises)
|
| σm1 | - |
|
| σm2 | - |
Principal membrane stress
|
| αm | - |
Angle of principal membrane stress
|
The shear stresses are evaluated differently for thick-walled and thin-walled cross section. For thick-walled (solid) sections the real τxy or τxz are calculated and displayed. For thin-walled sections the final shear flow from unit forces in Y or Z directions are evaluated and displayed as total shear flow τxs = √(τxy ² + τxz²). See also chapters in manual related to calculation of sectional characteristics.
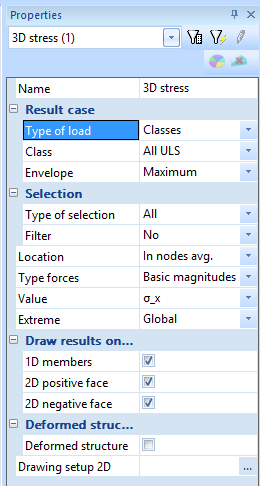
the property group Result case enables to specify the loading conditions for which the result is calculated. it enables to select from available Types of load (Load case, Combination, Nonlinear combination, Result class, ...) and then the particular instance for selected Type of load.
For envelope combinations or for result classes it is possible to switch between maximal or minimal values. This selection influences the values displayed as isolines. In each node of the isolines the maximum or minimum is taken as the result value.
The group selection enables to modify the range of entities where the results are displayed. It is possible to combine available selection types with filters. The final range of entities is the intersection of selection and the filter.
User can select between available magnitudes which are described above.
The selected magnitude is also used as the primary magnitude in the output tables. The extremes are searched for this selected value.
Setting of Extreme is respected in the tabular output only. The extreme setting for the graphical output is available inside the Drawing setup 2D.
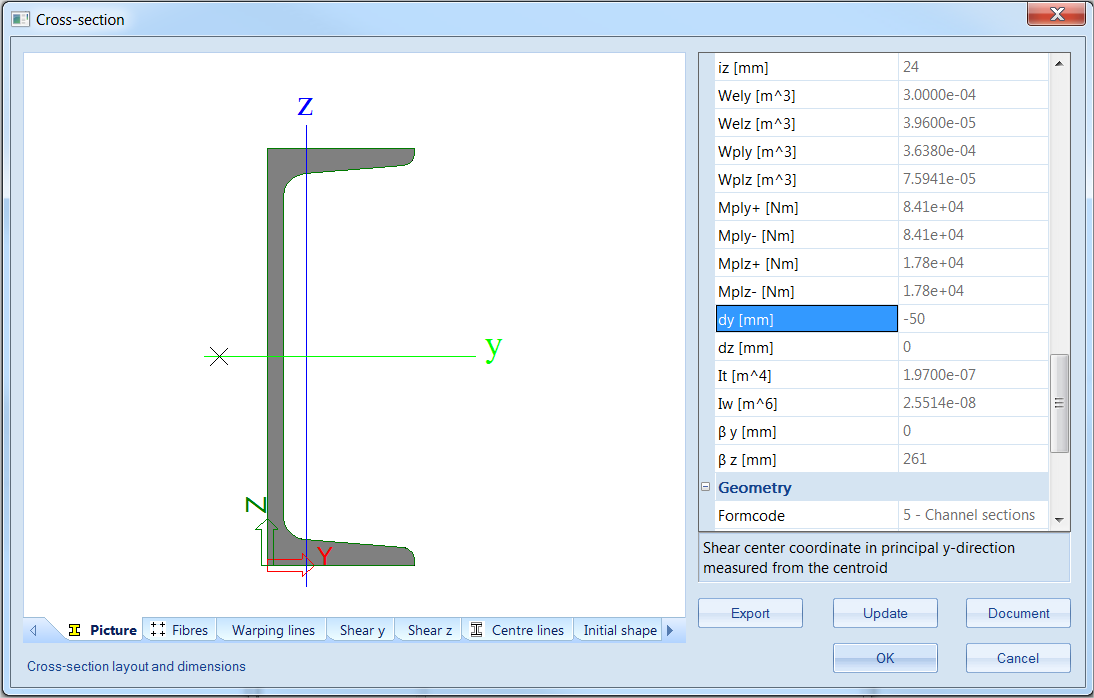
Shear stresses on 1D members are calculated by default from shear forces and torsion moment, where shear forces are considered to act in the shear centre of the beam's cross-section. In case of cross-section with different position of shear centre with respect to the centroid of gravity this approach leads to discrepancy in the position of acting forces. Typical example of such cross-section is hot-rolled U shaped cross-section:
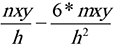
It is possible now to calculate and use the values of combined shear forces, bending moment and torsion moment with respect to the centroid of gravity. This functionality is enabled in result service "3D Stress" by check box "Consider torsion due to shear centre eccentricity".
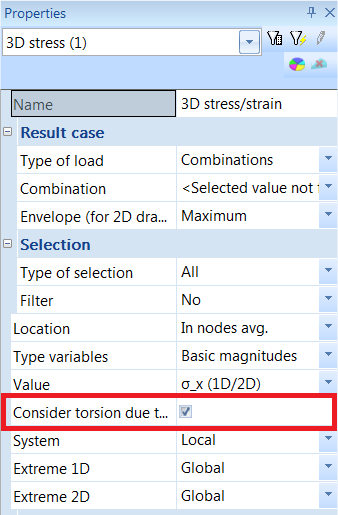
With this option on, the shear forces are considered to act in the centre of gravity and therefore the shear stresses are magnified by additional torsion effect from eccentricity of shear forces.
In versions prior 15.3 this option is always considered as turned on by default.
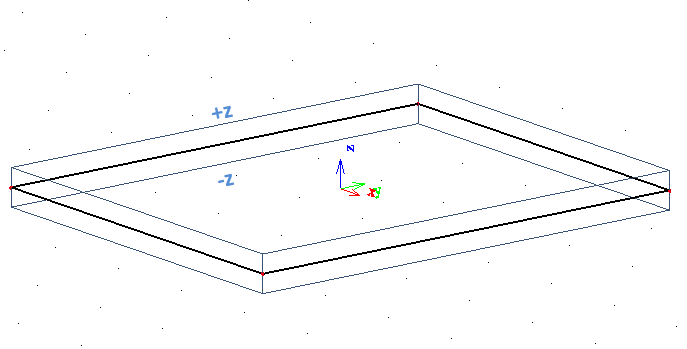
It is possible to switch ON/OFF drawing of results on 1D members or faces of 2D members.
Positive face is the face which is on +z local coordinate of the 2D member, negative face is on -z local coordinate of the 2D member.
The result stress values can be displayed also on the deformed surface of the structure.
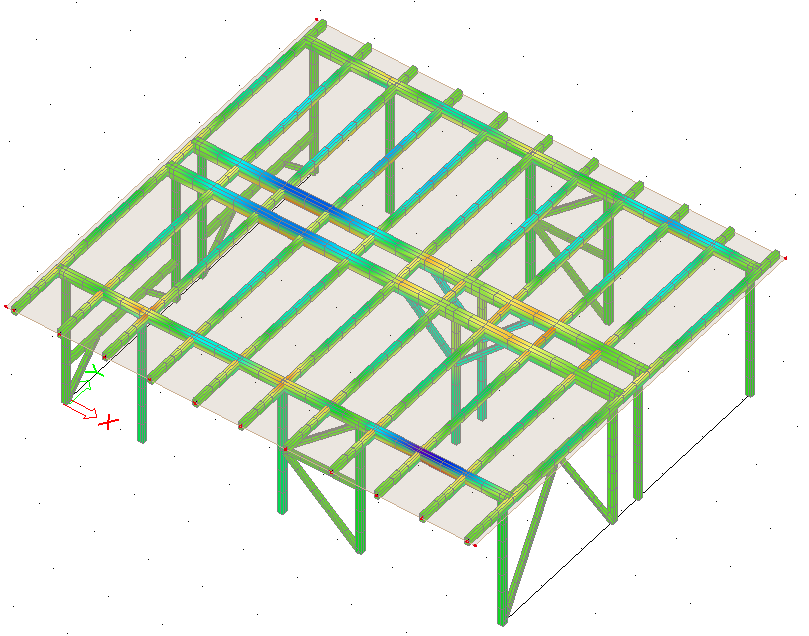
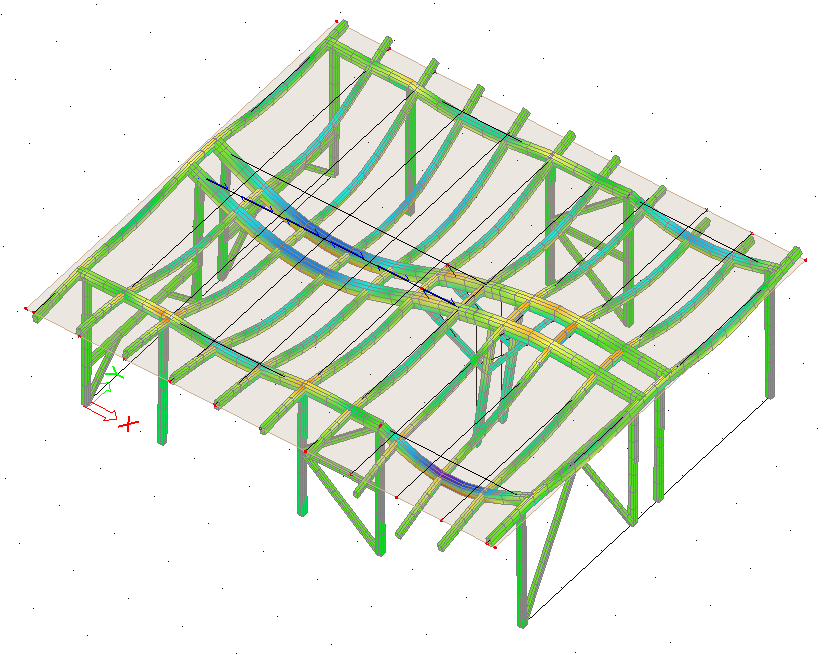
For more details please see 3D displacement.
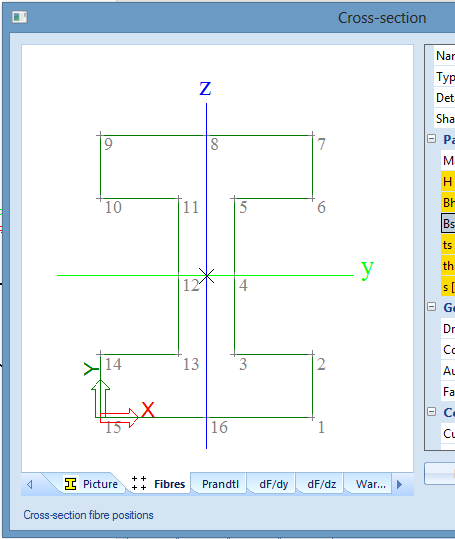
Result values are calculated in fibres. Position of fibres is visible in the cross section editing dialogue.
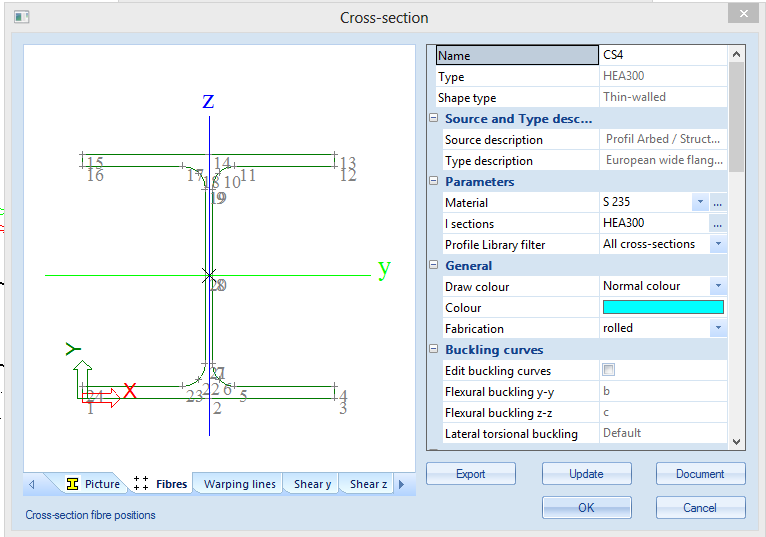
The t_xs magnitude represents the total shear flow which is in the thin-walled cross section. Distribution of this shear flow from horizontal a vertical unit shear forces can be checked in the cross section manager.
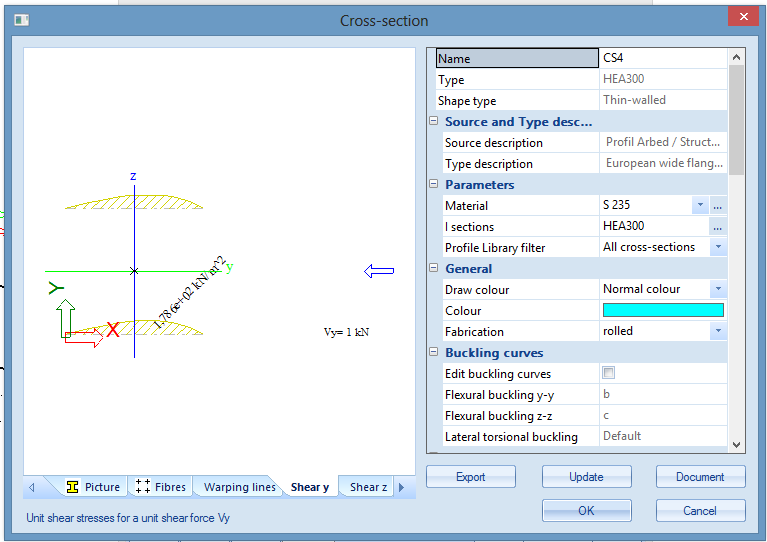
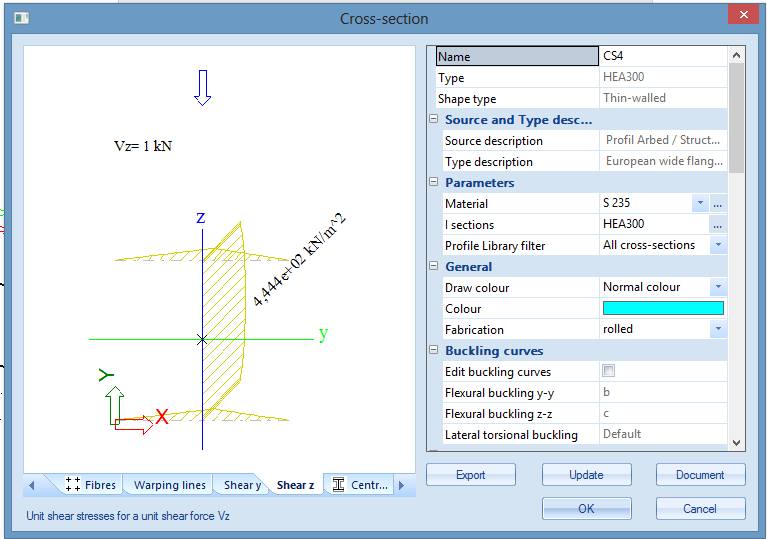
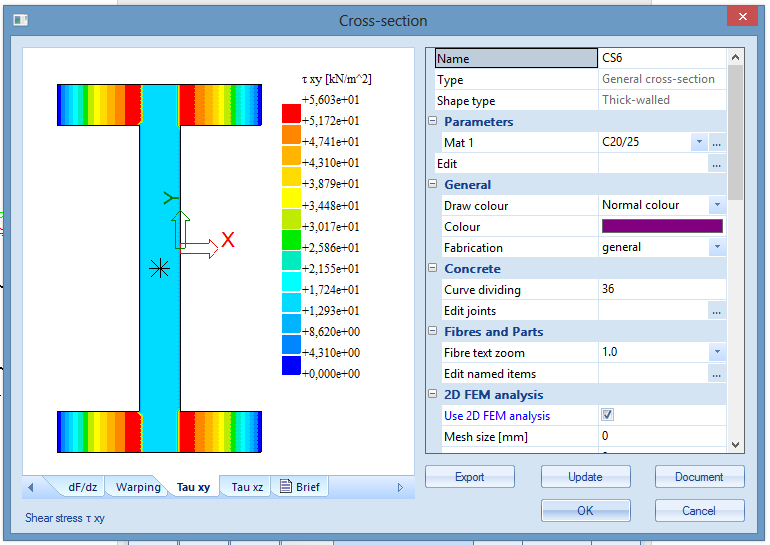
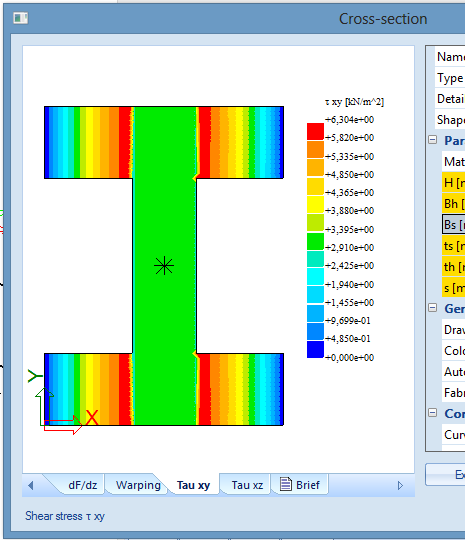
It is necessary to take into account that result are calculated in fibres only. Values between fibres are linearly interpolated. In some cases this precondition results in omitting of some local extremes. Example of this phenomenon is visible on following pictures:
There is a thick-walled I cross section exposed to horizontal shear force:
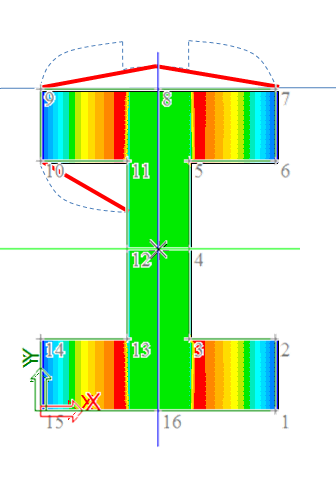
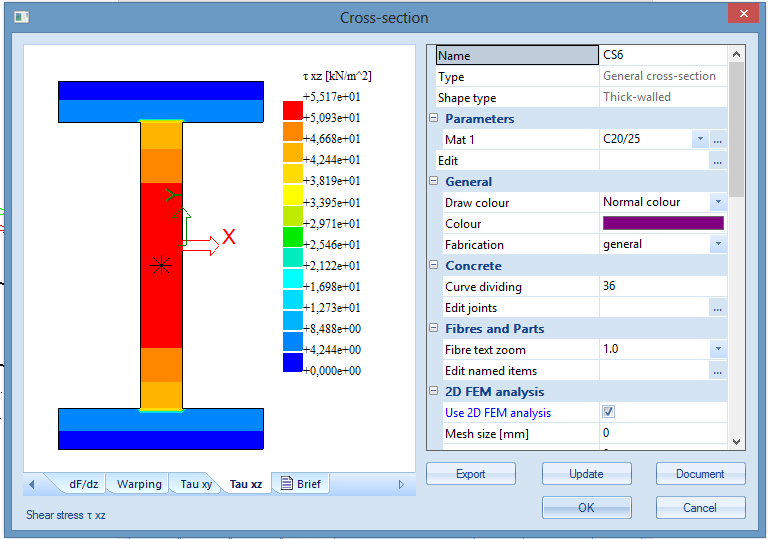
The third picture shows distribution of shear XY on the edge between fibres 7, 9. The theoretical distribution is shown by the dashed light blue line. the red line shows distribution which is presented by the 3D stress result. The reason is quite clear. The distribution of stresses is linear interpolation between values in fibres and the only fibre between fibres 7 and 9 is fibre 8 which has quite low value. Therefore the higher shear stress on exceeding parts of flanges are not respected on this edge.
This higher shear stress from exceeding part of flanges is displayed correctly on the inner edge 10-11 as is also visible on the picture.