Drawing setup 2D
How the standard results for 2D members can be displayed, is set in 2D drawing setup. This setting is accessible from any result or check which deals with 2d results. All the options are handled from separate dialog (which is different from" Drawing setup 1D")

Because setting of the drawing depends also on chosen Location, here is an overview table:
|
Location |
Available for | ||||||||||||||||||||
| One colour | Colours | Smooth | Coloured mesh | Isolines | Isobands | Labeled isolines | Numbers | 3 colours | 3 colours with numbers | 3 colours diverging colour map | |||||||||||
| In centres |
|
|
|
|
|
|
|
|
|
|
Yes | ||||||||||
| In nodes, no avg. |
|
|
|
|
|
|
|
|
|
|
No | ||||||||||
| In nodes, avg. |
|
|
|
|
|
|
|
|
|
|
No | ||||||||||
| In nodes, avg. on macro |
|
|
|
|
|
|
|
|
|
|
No | ||||||||||
For services Thickness of slabs and Surface loads, new 2D drawing style has been introduced "3 colours diverging colour map". The overview of the drawing styles available for these services is in the table below. Note: the location as summarized in the table above is for this new style considered as "in centres" only, as the value of the entity it is used for (thickness or 2D surface load) through whole the mesh element is the same.
|
Service |
Available for | ||||||||||
| One colour | Colours | Smooth | Coloured mesh | Isolines | Isobands | Labeled isolines | Numbers | 3 colours | 3 colours with numbers | 3 colours diverging colour map | |
| Thickness of slabs |
Yes |
No |
Yes |
No | No | No | No | Yes | No | No | Yes |
| Surface loads |
Yes |
No |
Yes |
No |
No |
No | No | Yes | No | No | Yes |
All of the display settings has some common settings, shared across all of them. Not all of them is applicable for each.
Display – one colour
Draws result in shades of one colour, scaling the result palette from min to max value
Display – colours
Each mesh element has its own colour according to value in the centre.
Display – smooth
Smooth transition between values.

Display – coloured mesh
Mesh is drawn in colours which corresponds to values.

Display – isolines
Mesh is drawn in colours which corresponds to values.

Display – isobands
Mesh is drawn in colours which corresponds to values.

Display – labelled isolines
Mesh is drawn in colours which corresponds to values.
Display – numbers
Shows values in nodes, according to FE location

Display – 3 colours
User can set bottom and upper value with three colours connected to these values. What colour will be drawn below limit, in limit and over the limit value. Very useful for unity checks.
Display – 3 colours with numbers
User can set bottom and upper value with three colours connected to these values. Values will be drawn in colour as set - below limit, in limit and over the limit value. Very useful for unity checks.

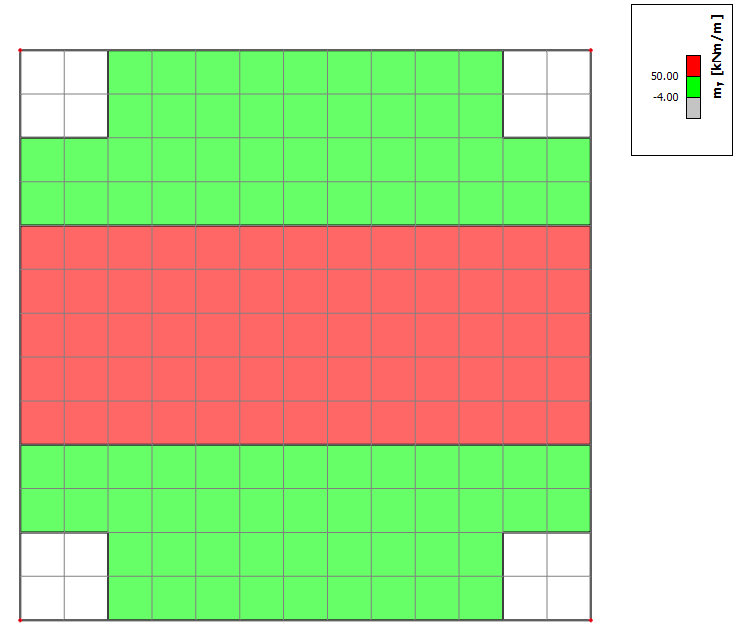
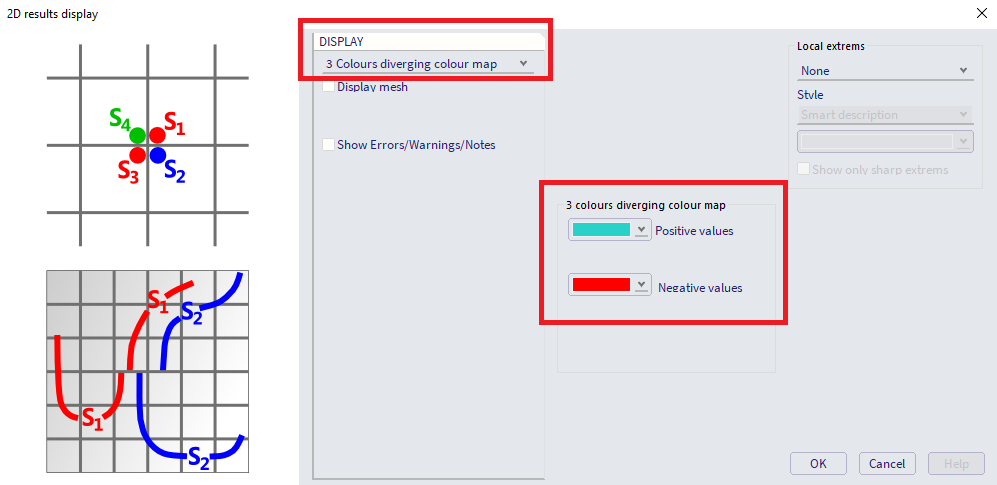
Display – 3 colours diverging colour map
Introduced since version 22.0. Applicable for services Thickness of slabs and Surface loads.
User can select a colour for positive and negative values. The colour for 0 value is always white. The selected colour for positive values is assigned to the maximal positive value from a current selection. The colours between this positive value and 0 value are interpolated in the shades of this value utilizing a diverging colour map and a scale between 0 (white) and the maximal value (user selected colour). Analogically, the same is applied for the negative values - user selected colour for negative values is assigned to the minimal, but always negative value (maximal absolute value) from the current selection.
Example utilizing two colours: Turquoise (SCIA-new-GUI-colour) shades for the positive values, and red shades for the negative values. The value for 0 is always white, not possible to be altered by the user.
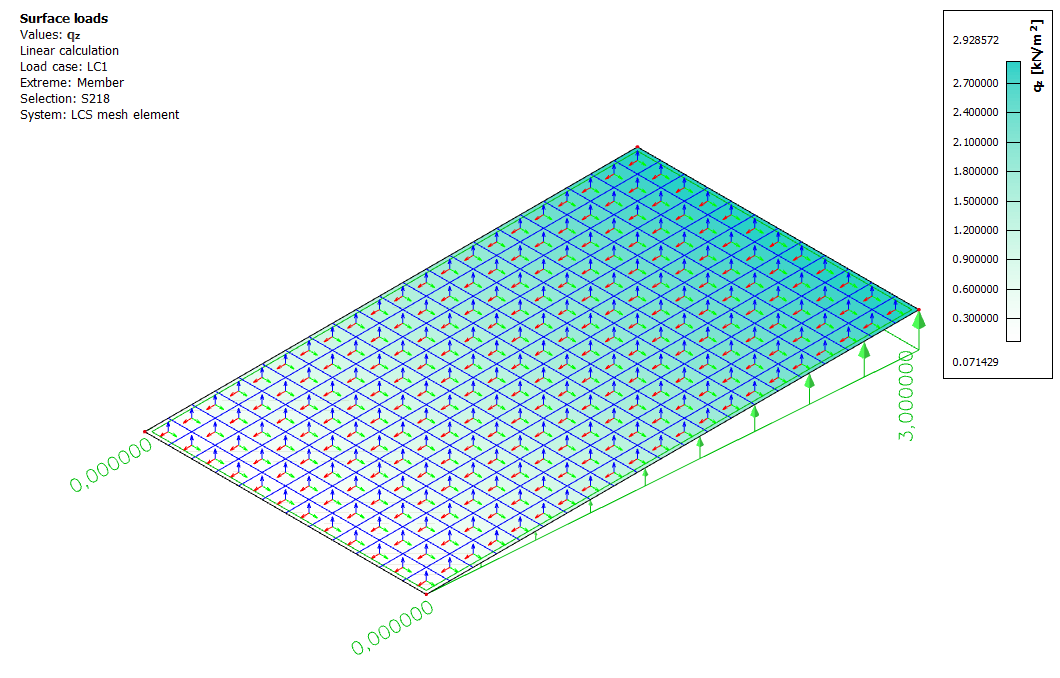
In the figure below, there are several slabs of various angles between their normal and the z-axis of the GCS. The Surface loads for the self weight load case are discussed (note: even thought the self-weight is truly surface load, but the response is the same for this example as for appropriate surface load of corresponding direction). The self weight acts in the z direction of the GCS, and surface loads "qy" are being plotted in the local coordinate systems of the mesh elements (y axes are the little green arrows). The diverging colour map is discrete, as currently there are less then 20 different numerical values of this load.
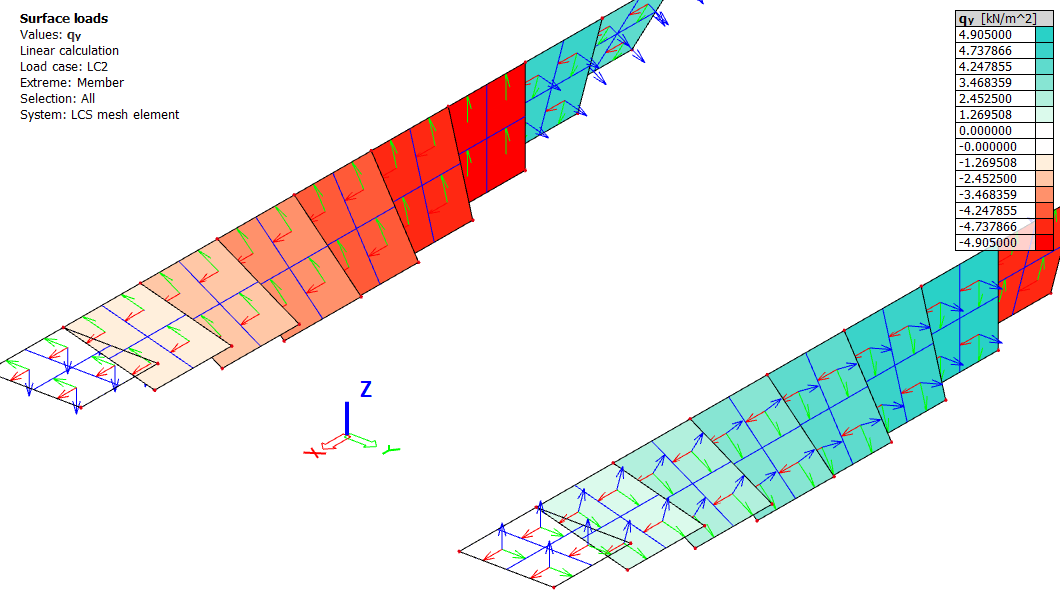
If there are only values of one sign in the current selection, for example only positive values, the part of colour map assigned to the negative values (in this case shades of red) is ignored (and vice versa). An example is provided in the figure below. Diverging colour map is now continuous, because the number of the values is larger then 20 (what is the limit for the legend). The loads from load case for which this surface load is being plotted are shown as well.