Reduced Analysis Model
Introduction: the modified IRS method
The actual tendency in FE structural analysis is using full 3D modelization of the considered structure. SCIA Engineer obeys that rule as structures are usually modelized in 3D using beam and shell elements, including buildings.
Once a detailed 3D modelization is ready for statical analysis of a structure, it is natural to use it also for dynamic analysis and, more specifically, for seismic design. A typical issue of full 3D modelization is, that seismic design regards mostly the overall behaviour of the structure whence the full mesh of the structure provides a lot of information about local behaviours. More specifically for modal analysis, the full mesh lets appear local vibration modes, which are irrelevant for the overall seismic response of the structure. It appears hence logical to use a different, reduced mesh for the dynamic analysis.
Well known matrix condensation techniques (Guyan Reduction, also known as static condensation [1]) allow obtaining very efficiently a reduced system, but those methods are not well suited for dynamic analysis. An Improved Reduced System (IRS) method has been developed [2] which takes into account not only the stiffness matrix of the system, but also the mass matrix during the condensation process. That method proved to give excellent results for dynamic analysis, with both modal analysis and direct time integration methods.
The algorithm implemented in SCIA Engineer used the IRS method and consists of 3 steps:
- The IRS method is used for condensing the mesh of the analysis model.
- The modal analysis is performed using the reduced mesh, which has typically 1’000 times less degrees of freedom than the original full mesh. This makes the calculation of eigenvalues massively faster on large structures and also avoids unwanted local modes. The latter is particularly interesting for seismic analysis.
- The results of the reduced system are expanded to the original full mesh, allowing for output of detailed results in the entire structure.
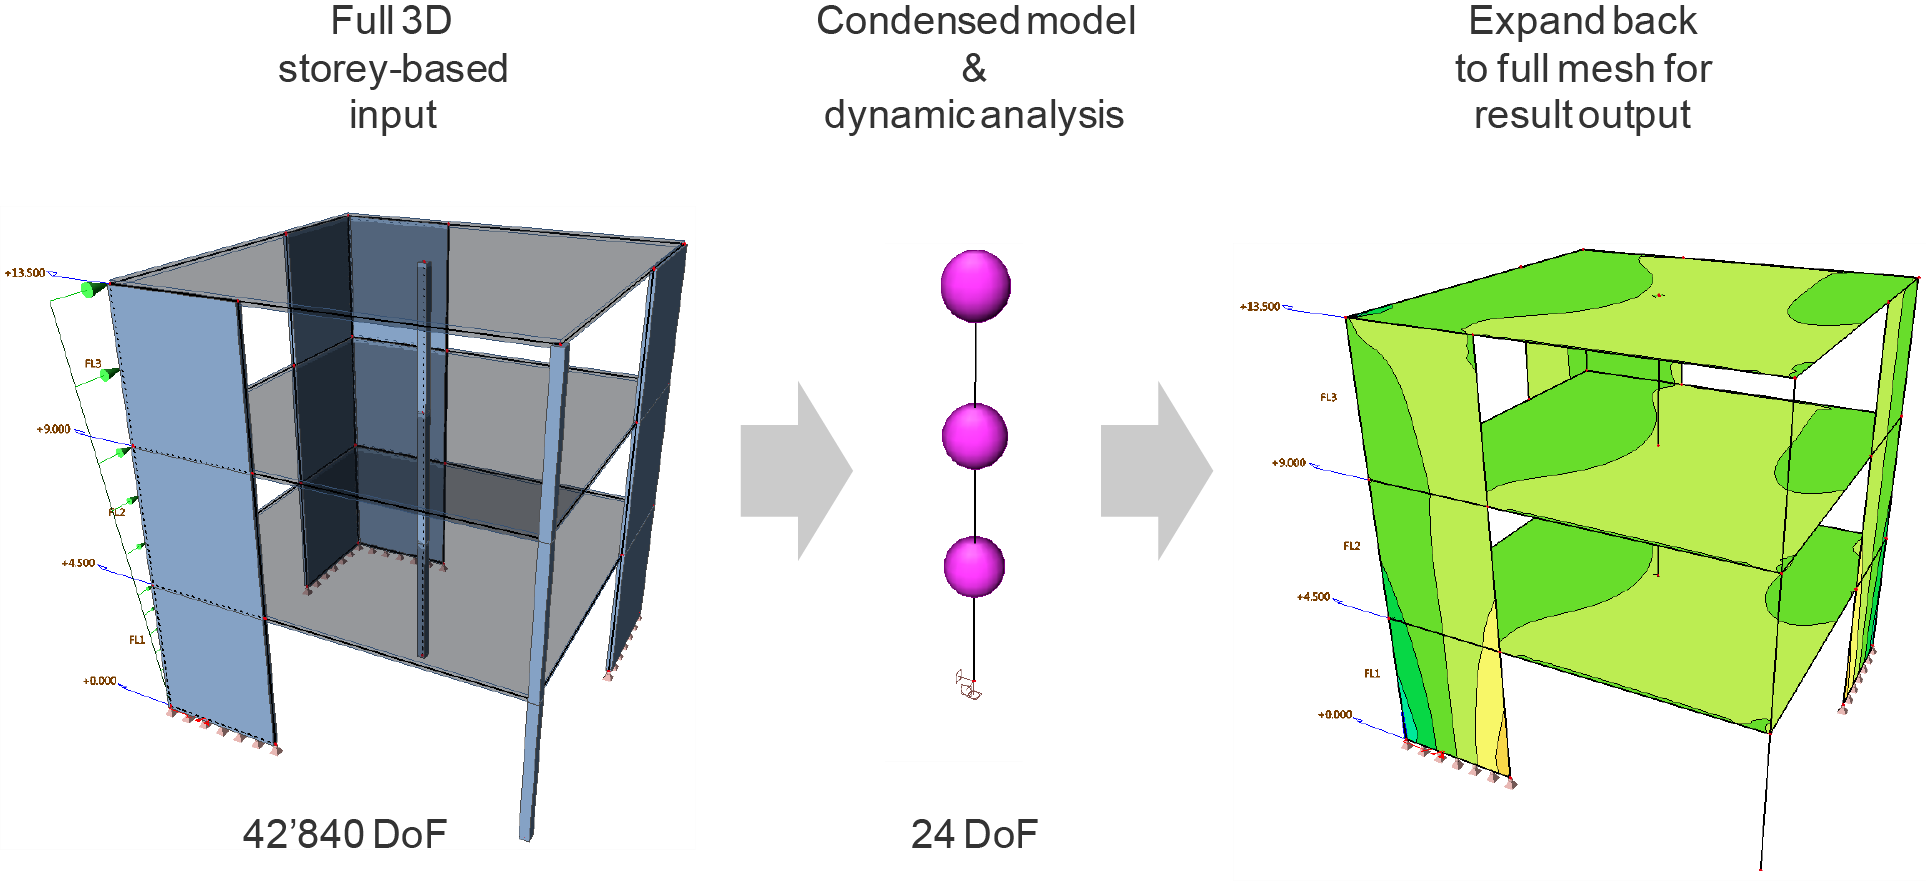
Although the reduced system (center picture) seems to look a lot like a classical 1-node-per-storey model, with equivalent stiffness of the supporting members, it is in reality a much more advanced. The main difference lies in the fact, that the mass matrix that is used is a full matrix (non diagonal), which allow to take into account the real eccentricity of the masses of each storey. Moreover, as the modal results are re-extrapolated to the original 3D mesh after the modal analysis, it provides a much higher level of detail.
IRS analysis vs diaphragms
Modelizing deck slabs as diaphragms in a building for seismic analysis is a common technique. It has several purposes:
- elimination of irrelevant, local bending vibration modes in the slabs
- elimination of unwanted frame effects from the structural behaviour (by removing the bending stiffness of slabs)
- reduction of computation time
- easy handling of mass eccentricities for each deck
Items 1, 3 and 4 are addressed directly by the IRS analysis:
- local modes in all structural elements are implicitly removed, due to the elimination of unwanted degrees of freedom. Of course, adding more reduction nodes would allow for more detailed analysis of local modes, but it is particularly interesting for seismic analysis to keep in the reduced model only the nodes that are strictly necessary to reproduce the typical seismic behaviour of a building. Ultimately, it is up to the user to choose the reduction points in such a way that the wanted eigenmodes are obtained.
- the computation time is reduced, due to the drastic reduction of the number of degrees of freedom; actually, the reduction is even more important than with diaphragms, as supporting members are also condensed. The reduction of computation time affects only the computation of the eigenmodes itself. The pre- and post-processing times remain practically unchanged, which include overall data preparation, mesh generation and modal superposition of local results. These operations are, obviously, still performed on the full mesh of the model and can be quite time consuming.
- the IRS analysis uses a full mass matrix, which allows for exact implementation of mass eccentricity in each node of the reduced system
Item 2 – removal of frame effects – is not addressed by the IRS analysis in itself, as it does not modify the mechanical behaviour of the structure. However, as unwanted local bending modes are implicitly removed from the reduced system, so-called flexible diaphragms may be easily simulated by significantly reducing the bending stiffness of deck slabs. Not only does that allow to obtains classical diaphragm behaviour by means of a very low bending stiffness, but also intermediate behaviour where the bending stiffness is less drastically reduced and frame effects are therefore reduced, but not completely removed.
Using diaphragms and IRS analysis together is actually possible. Diaphragm constraints may be used to eliminate completely frame effects due to the bending stiffness of the slabs, and still benefit from the other advantages of the reduced system. Diaphragms are currently supported only for composite decks in SCIA Engineer.
Benchmarks
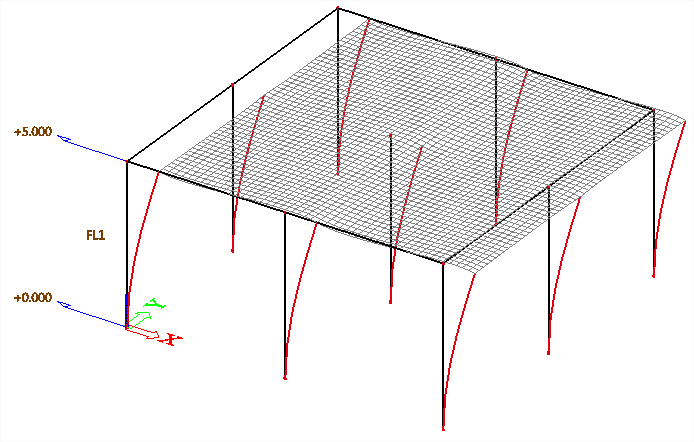
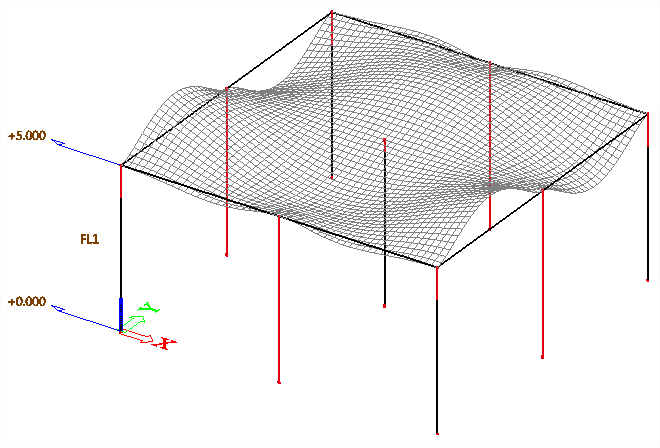
Example 1: simple platform
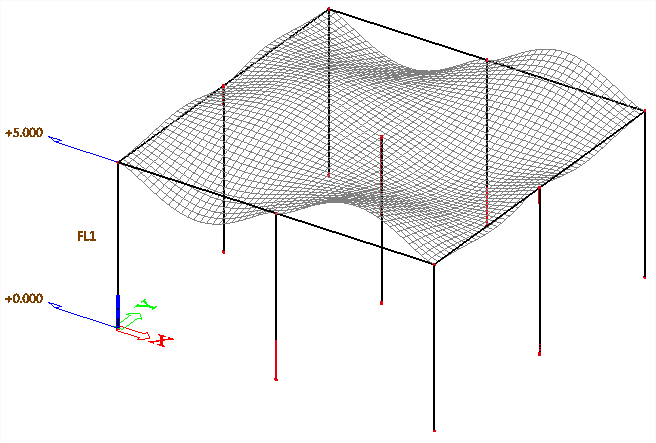
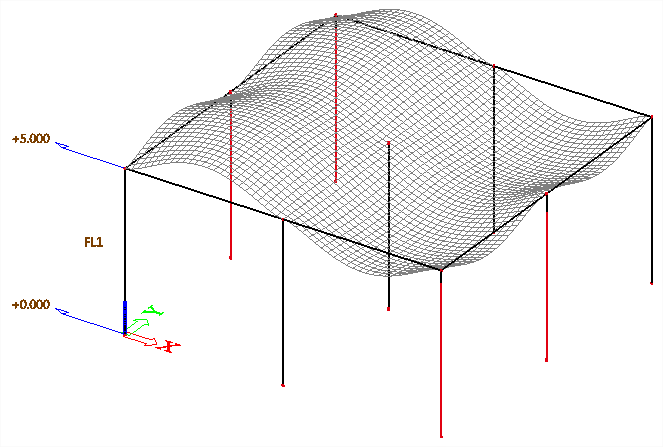
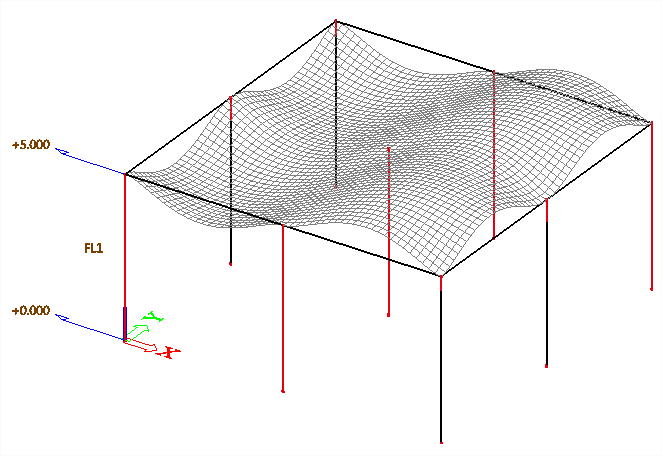
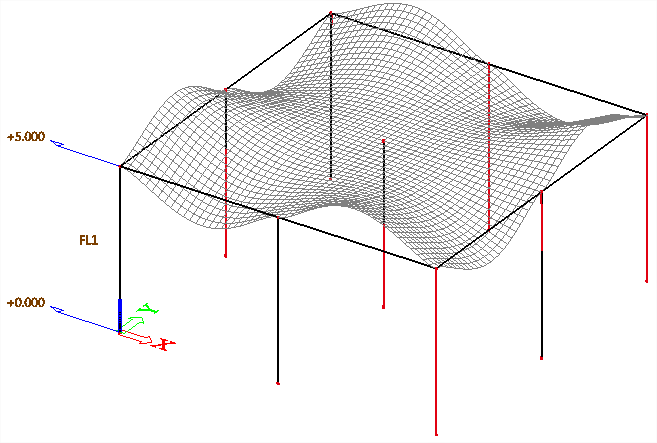
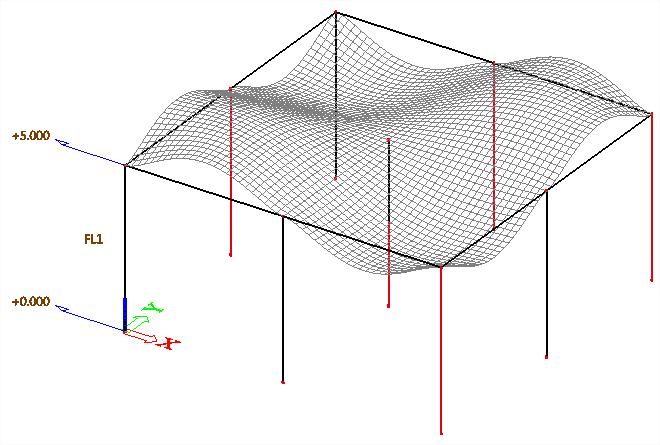
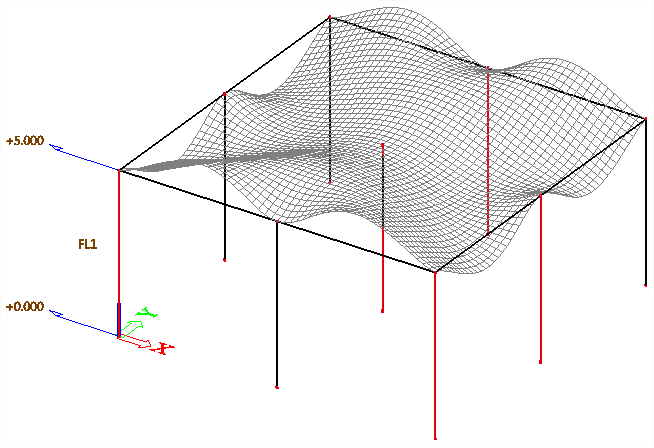
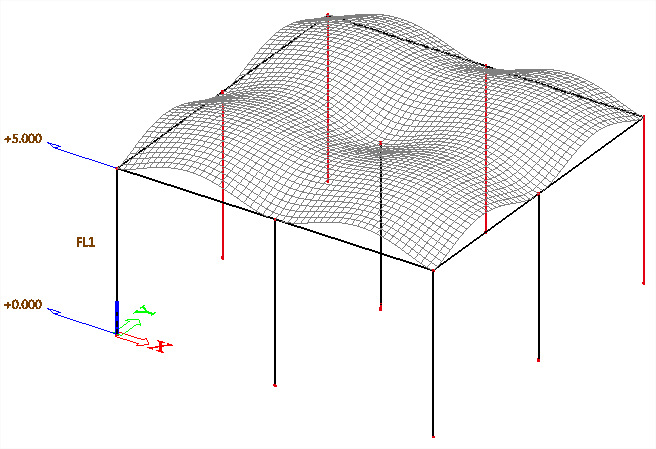
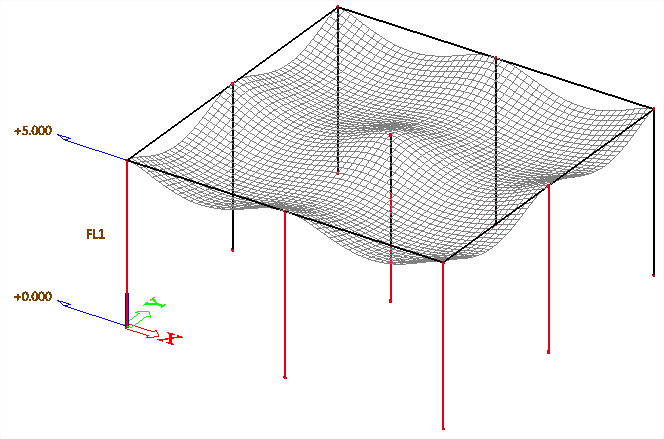
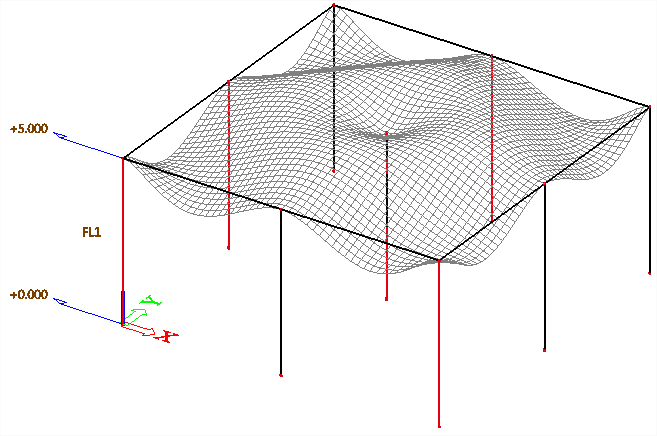
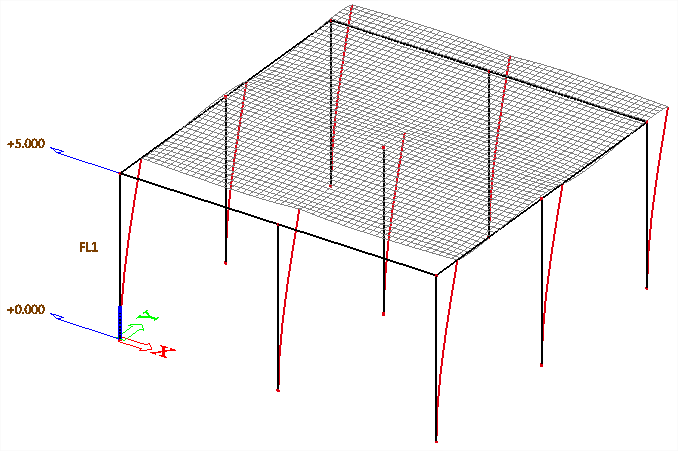
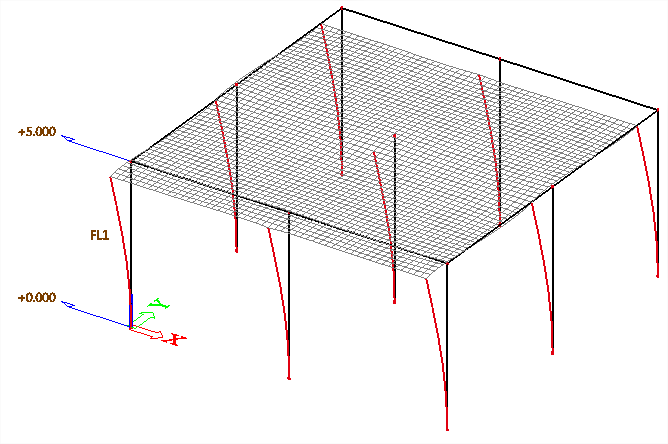
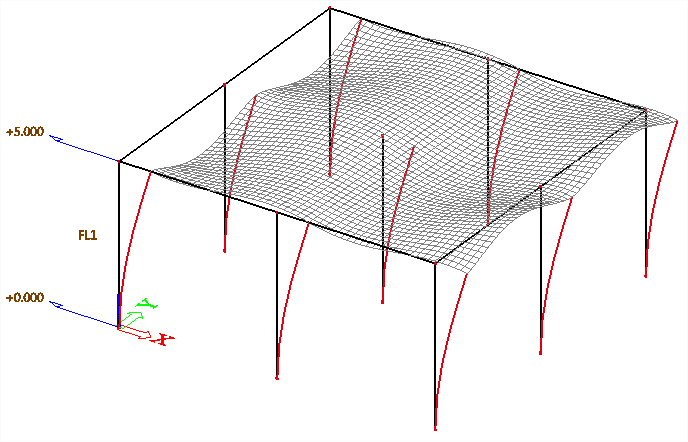
The structure is a simple platform, with 9 steel columns and a thin plate on the top. This academic example only intends to illustrate some aspects of the method.
The reduced model consists of 2 R-nodes, located at the top and at the bottom of the middle column.
The table below shows the natural frequencies and eigenshapes for both full mesh and IRS analysis. The 11 first modes are displayed for the full mesh analysis, along with the corresponding modes from the IRS analysis.
As expected, there are gaps in the IRS list, as the DoF of the reduced model cannot represent all the bending modes of the plate. Those modes are anyway irrelevant for the seismic behaviour of the structure. Apart from the change of sign for most eigenmodes, it is clear that the correspondence is excellent for both frequency and mode shape for eigenmodes that are significant for seismic behaviour.
| Full Mesh analysis | IRS analysis | Full Mesh analysis | IRS analysis |
|---|---|---|---|
|
Mode 1 – 1.15 Hz
|
Mode 1 – 1.17 Hz
|
Mode 7 – 2.10 Hz
|
N/A |
|
Mode 2 – 1.15 Hz
|
Mode 2 – 1.17 Hz
|
Mode 8 – 2.15 Hz
|
N/A |
|
Mode 3 – 1.21 Hz
|
N/A |
Mode 9 – 2.27 Hz
|
N/A |
|
Mode 4 – 1.23 Hz
|
Mode 3 – 1.23 Hz
|
Mode 10 – 2.30 Hz
|
N/A |
|
Mode 5 – 1.42 Hz
|
Mode 4 – 1.42 Hz
|
Mode 11 – 2.32 Hz
|
Mode 5 – 2.32 Hz
|
|
Mode 6 – 2.10 Hz
|
N/A |
The next table shows the modal masses for both models. Significant modes for seismic behaviour are spread up to mode 11 for full mesh analysis. For IRS analysis, they are all grouped are the beginning of the list. Note that the first two modes are pure bending modes and would definitely not occur in a building.
Another important point is, that the obtained total modal mass is higher with the IRS analysis. The 12 listed modes represent all the eigenmodes of the reduced model, as it has 12 DoF. That is the reason why the IRS analysis obtains 100% of the mass. For the full mesh analysis, it is normal that the obtained modal mass is lower, as there are many more modes that are not listed here.
| Full Mesh analysis | IRS analysis | |||||||||
|---|---|---|---|---|---|---|---|---|---|---|
| Mode | Freq. | Wxi / | Wyi / | Wzi / | Mode | Freq. | Wxi / | Wyi / | Wzi / | |
| [Hz] | Wxtot | Wytot | Wztot | [Hz] | Wxtot | Wytot | Wztot | |||
| 1 | 1.15 | 0 | 0.0001 | 0 | 1 | 1.17 | 0 | 0.0003 | 0 | |
| 2 | 1.15 | 0 | 0 | 0 | 2 | 1.17 | 0 | 0 | 0 | |
| 3 | 1.21 | 0 | 0 | 0 | 3 | 1.23 | 0 | 0 | 0.8934 | |
| 4 | 1.23 | 0 | 0 | 0.887 | 4 | 1.42 | 0 | 0.9987 | 0 | |
| 5 | 1.42 | 0 | 0.9981 | 0 | 5 | 2.32 | 0.999 | 0 | 0 | |
| 6 | 2.10 | 0 | 0.0001 | 0 | 6 | 2.71 | 0 | 0 | 0 | |
| 7 | 2.10 | 0.0004 | 0 | 0 | 7 | 130.72 | 0 | 0.001 | 0 | |
| 8 | 2.15 | 0 | 0 | 0 | 8 | 205.43 | 0.001 | 0 | 0 | |
| 9 | 2.27 | 0 | 0 | 0 | 9 | 248.14 | 0 | 0 | 0 | |
| 10 | 2.30 | 0 | 0 | 0.0001 | 10 | 413.53 | 0 | 0 | 0.1066 | |
| 11 | 2.32 | 0.9644 | 0 | 0 | 11 | 711.66 | 0 | 0 | 0 | |
| 12 | 2.47 | 0 | 0.0011 | 0 | 12 | 737.23 | 0 | 0 | 0 | |
| 0.9648 | 0.9994 | 0.8871 | 1.00 | 1.00 | 1.00 | |||||
Example 2: 7-storey building
This example is a real, 7-storey building. No particular simplification has been done to create the model for the seismic analysis from the static modelization.
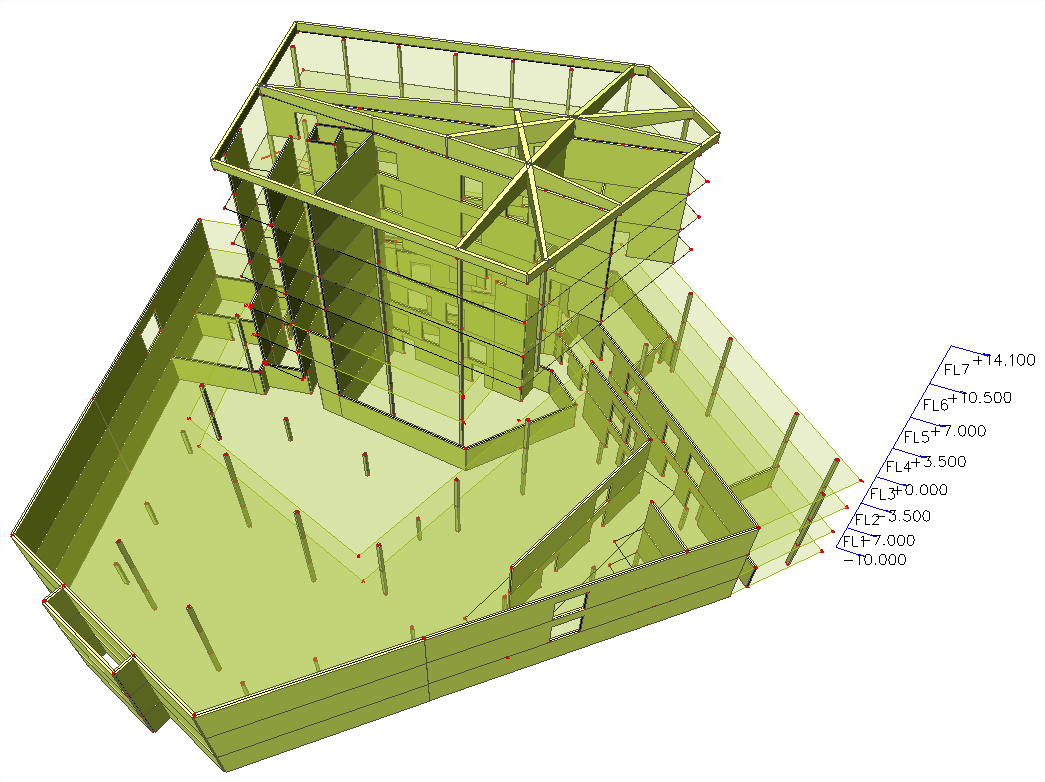
Building of the ACPC, Fribourg, Switzerland
Courtesy of GIBES Engineering Group, Lausanne, Switzerland
| Full Mesh analysis | IRS analysis | |
|---|---|---|
| Degrees of freedom | 152’988 | 48 |
| Requested modes | 320 | 48 |
| Total time: data generation, modal analysis, seismic analysis | 31’27” | 5’17” |
| Obtained total modal mass (X / Y / Z) | 90% / 94% / 78% | 95% / 96% / 98% |
| Count of most significant modes to obtain 90% modal mass | 187 / 103 / >320 | 14 / 17 / 8 |
Note: 320 is the number of eigenmodes that is required in this case to obtain 90% of cumulated modal mass in both X and Y directions. For the vertical direction, over 400 modes would be necessary (not calculated).
| Full Mesh analysis | IRS analysis | |||
|---|---|---|---|---|
| 1st most significant mode in X direction | 3.12 Hz (3) | 32.2% | 3.12 Hz (3) | 33.0% |
| 2nd most significant mode in X direction | 7.38 Hz (18) | 8.4% | 14.56 Hz (30) | 11.5% |
| 1st most significant mode in Y direction | 1.71 Hz (1) | 20.7% | 1.71 Hz (1) | 20.7% |
| 2nd most significant mode in Y direction | 2.44 Hz (2) | 13.2% | 2.44 Hz (2) | 13.2% |
| 1st most significant mode in Z direction | 5.16 Hz (7) | 9.6% | 115.57 Hz (46) | 36.4% |
| 2nd most significant mode in Z direction | 5.14 Hz (6) | 7.0% | 5.60 Hz (7) | 19.1% |
About the Z direction: eigenmode 46 @ 115 Hz is not represented in the full mesh analysis because the last computed mode (320) reaches only 29 Hz. That particular mode is anyway irrelevant for the seismic analysis as it is completely out of the frequency range of an earthquake. The modes nr 7 in both models, although their frequency slightly differs, show practically the same deformed shape.
The final internal forces after modal superposition for the seismic analysis show very close results. In the main wall of the structure (picture below), the peak values of the vertical membrane force ny are only 2% apart. The entire result distribution is close to identical.
| Full Mesh analysis | IRS analysis |
|---|---|
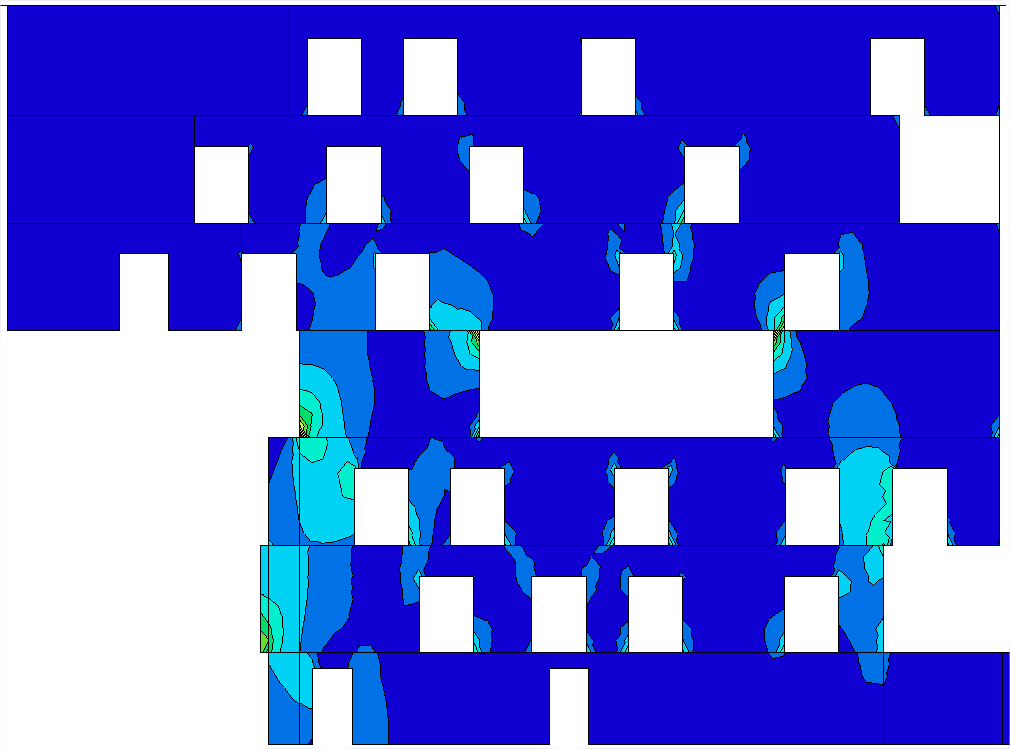
|
|
| nymax = 2’362 kN/m | nymax = 2’416 kN/m |
Using the IRS model in SCIA Engineer
Unlike the classical modal analysis, which typically uses a lumped mass matrix (only diagonal terms are non-zero), the reduced system uses a full mass matrix , with non-zero values out of the diagonal. This means that mass eccentricities can be taken into account easily by the reduced system. The very small size of the reduced system allows using the full mass matrix.
Therefore the reduction points – or so-called R-nodes – that will constitute the reduced model do not need to be located in a particular position, such as the mass center of each storey. As the structure may have to be calculated several times with various distributions of the masses, the mass center of each storey is likely to be slightly different depending on the selected mass combination. Thanks to the use of a full mass matrix, the same R-nodes may be used in all cases.
Another benefit of the IRS analysis is, that the exact position of the mass center of each storey does not need to be know beforehand. It is automatically calculated during the condensation process and can be obtained as a result of the analysis.
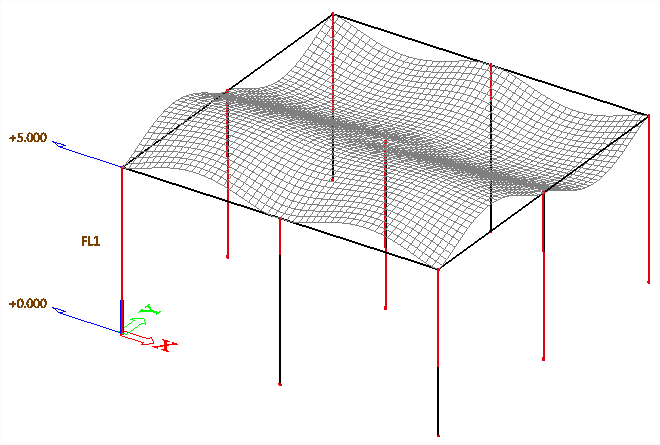
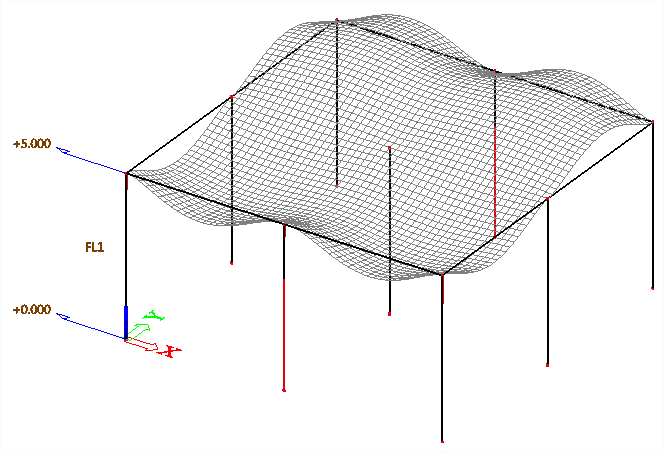
During the analysis, the reduced model is computed automatically from the full mesh. Each node of the full mesh is mapped to the closest R-node of the reduced model.
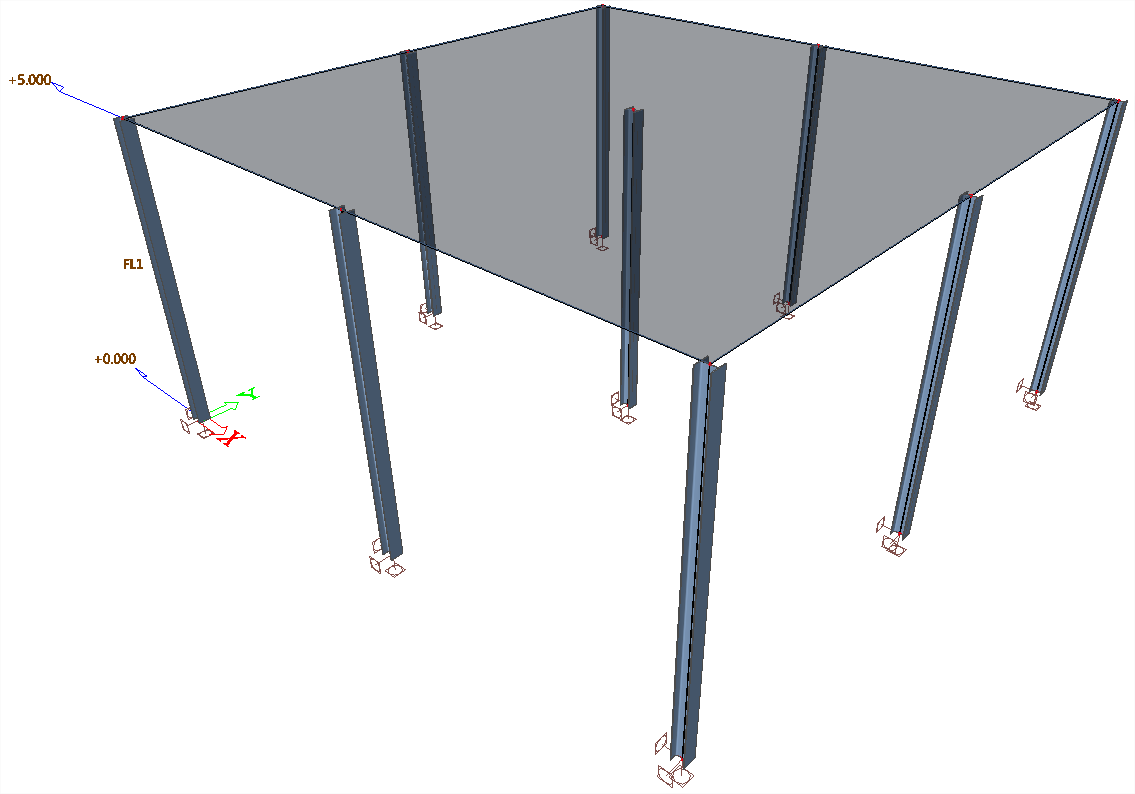
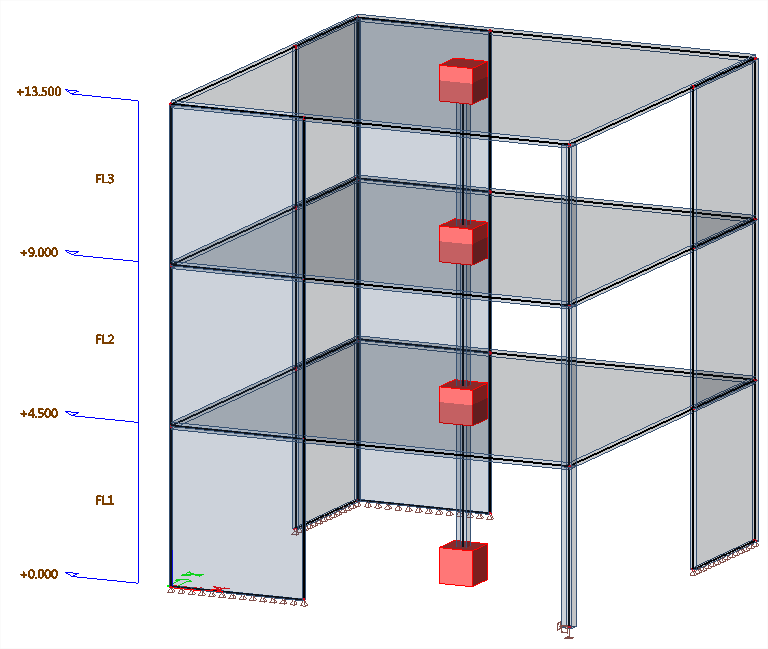
It is up to the user to define how many R-nodes will be used for the analysis and, therefore, how many degrees of freedom the reduced model will have. For seismic analysis of buildings, the typical reduced model consists of 1 R-node per storey, i.e. per deck slab.
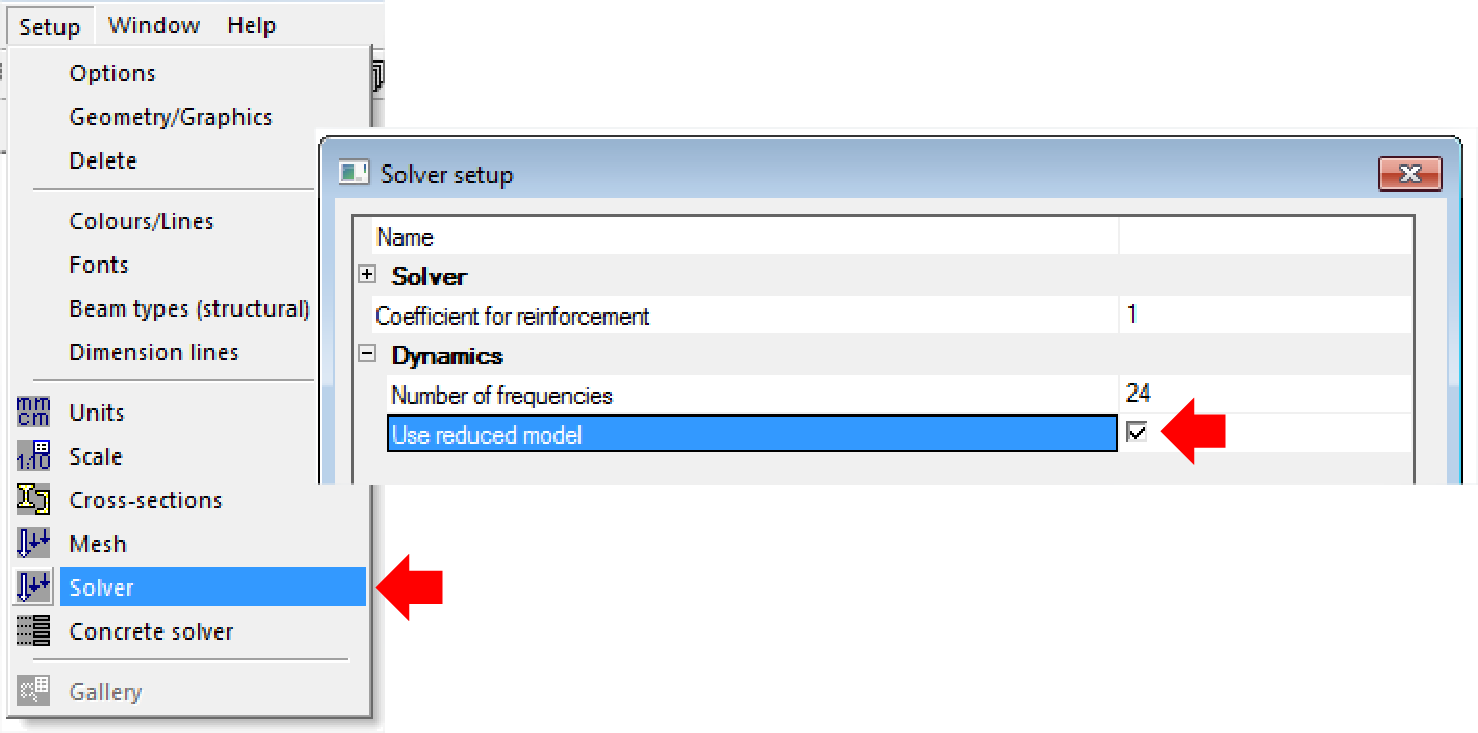
Enabling the reduced model
First of all, the reduced model analysis must be enabled in the project. For this, tick the option “use reduced model” in the solver settings.
Definition of the R-nodes
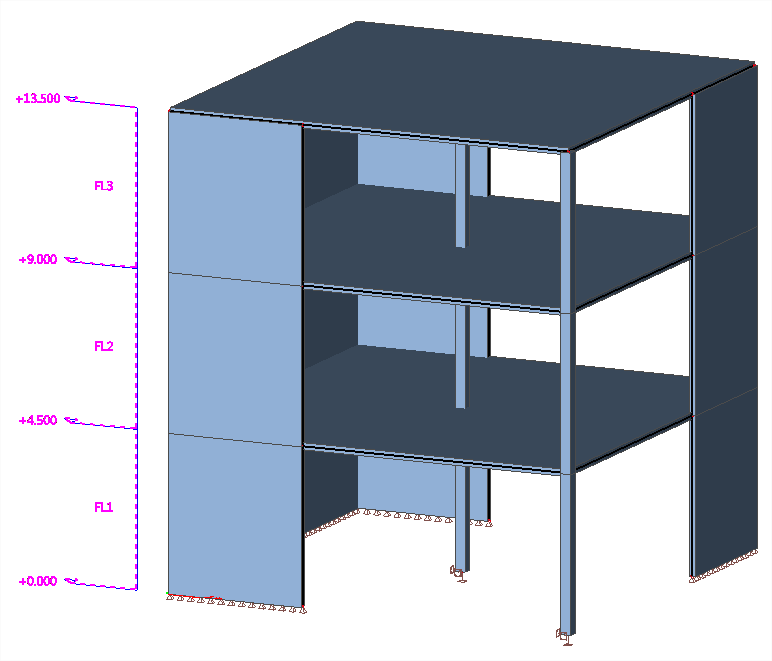
In SCIA Engineer 2013, the reduced model is defined directly from the storey data.
Storeys must be defined in the modelization. The program will create the reduced analysis model by creating one R-node per storey. This means that the reduced analysis model will be valid for buildings that have one deck slab per storey. Each deck slab may be made of several 2D members.
The program will place a R-node at each storey, in the middle of the bounding box of the structure:
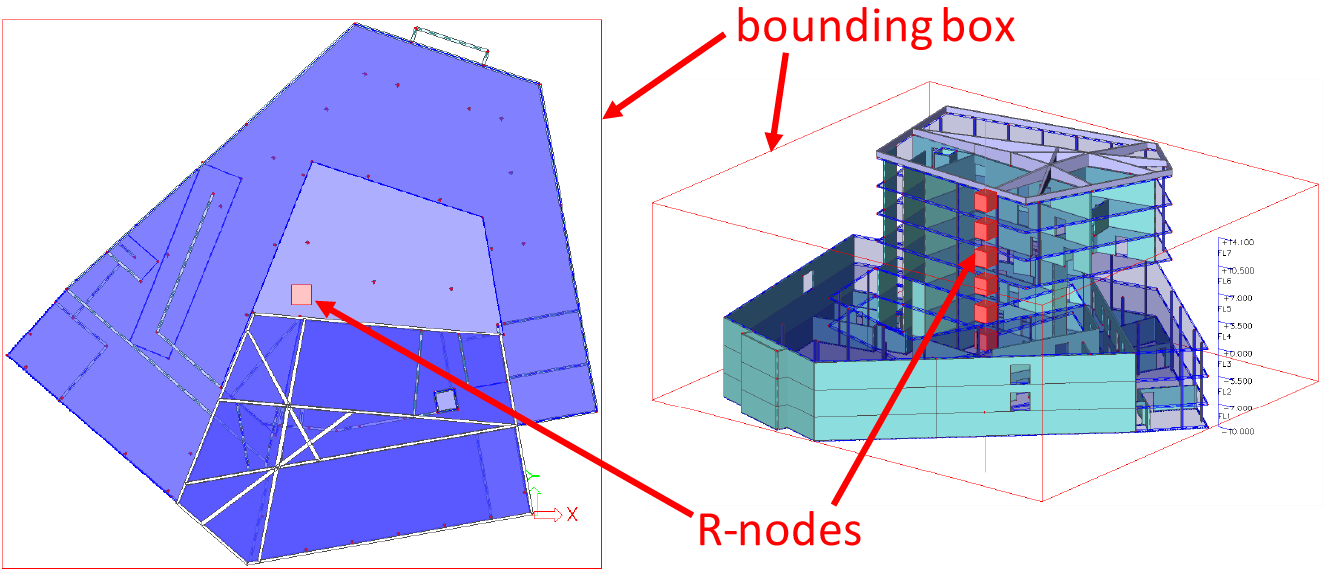
Note: this is a principle drawing. R-nodes are not displayed in SCIA Engineer.
Further development is planned, allowing more advanced layout of R-nodes, i.e. more than one per storey. The current version of SCIA Engineer allows for one R-node per storey.
Optionally, R-nodes may be placed at any level in each storey. The storey property “level of reduction point” allows to select the exact height of the reduction point for each storey separately. 0 corresponds to the bottom of the storey, 1 to the top of the storey.
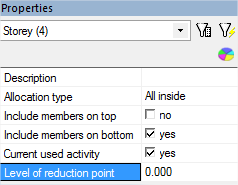
With the default settings (see above), the deck slab of each storey is located at the bottom of the storey, and so is the corresponding R-node. It is recommended to use those default settings.
As described before, R-nodes are placed in each storey, at the specified level, in the middle of the structure (all R-nodes are located on the same vertical axis).
During the analysis, the reduced model is automatically generated from the full mesh of the structure. Each node of the full mesh is mapped to the closest R-node. In a typical building configuration, this means that each R-node will receive the stiffness, loads and masses from the corresponding deck slab, from the top half of the supporting members below the slab and from the bottom half of the supporting members above the slab.
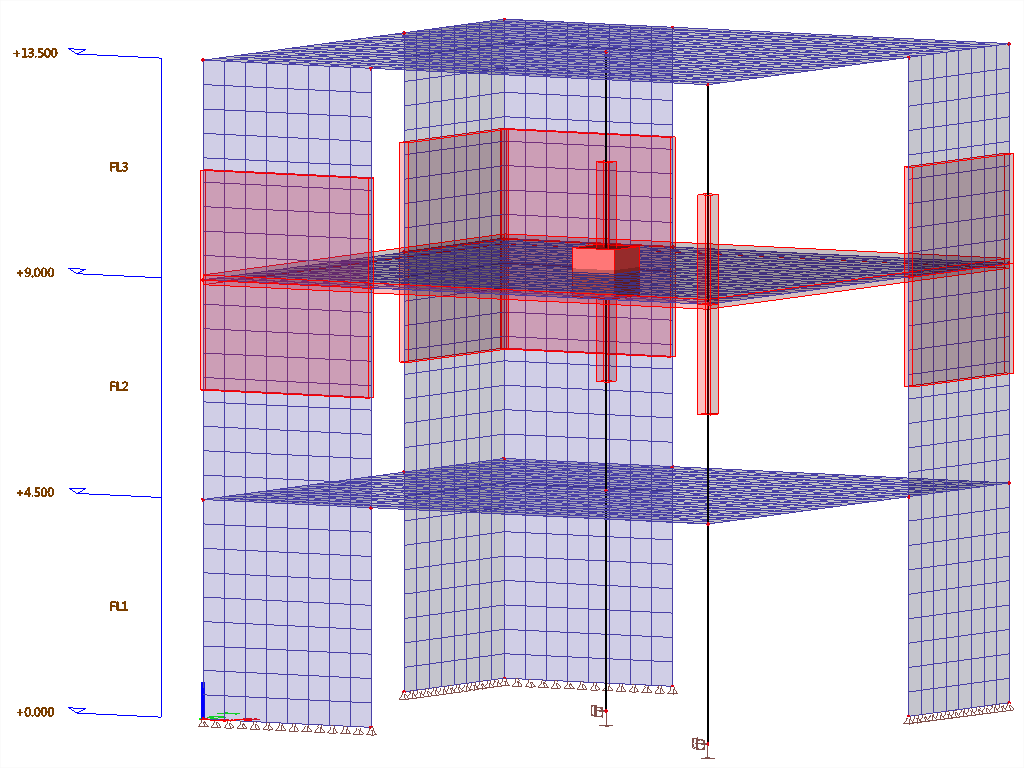
The concept of storeys in SCIA Engineer implies, that each structural member is allocated to at least one storey. That information is relevant for detailed storey results. However, it does not affect the reduced system. The nodes of the full mesh are mapped to the R-nodes of the reduced system purely based on their location (coordinates).
Running the analysis & Results output
Once the data has been prepared, the analysis is run exactly in the same way as for a standard analysis.
In SCIA Engineer, the IRS analysis will be used only for the calculation of the eigenmodes of the structure. On the basis of those eigenmodes, the actual calculation of seismic load cases will be performed on the original, full mesh.
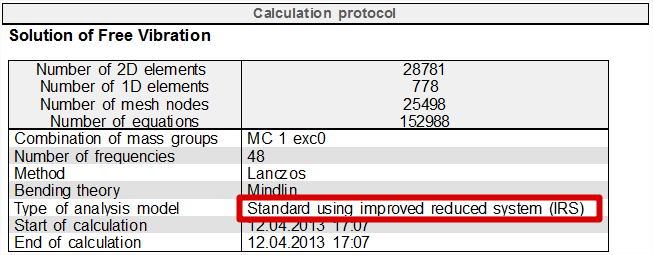
The use of the IRS analysis appears in the calculation protocol:
There are fundamentally two types of results available after an IRS analysis:
- The results of the reduced model are automatically expanded to the original mesh and are accessible through standard output. This will not be detailed here.
- Some dedicated results, coming directly from the reduced model, are available in the result service Summary Storey Results. This typically gives information about the masses, displacements and accelerations at the mass center each storey in the reduced model.
See information about typical solver error when using IRS with a model that is not properly configured: non-associated R-node.