Adjusting the style of result diagrams for 1D results (PPEv17)
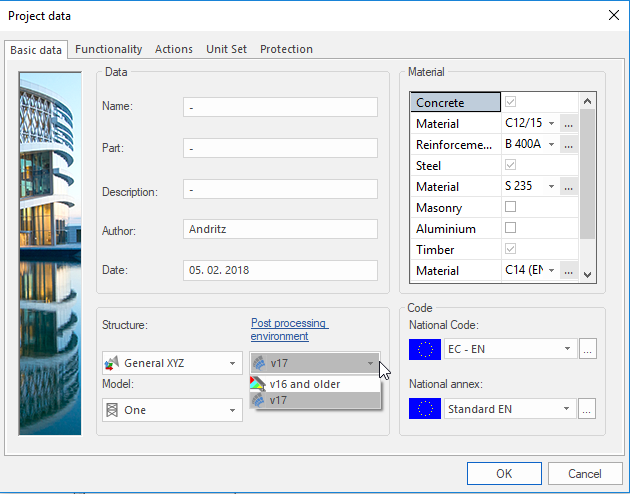
From version 17.0. there is possibility to use new post-processing environment for displaying results. The new post-processing environment could be enabled in the project dialogue. If you are not using the new post-processing environment but the environment from previous versions (v16 and earlier) adjust the drawing of results as described in following article:diagram style.
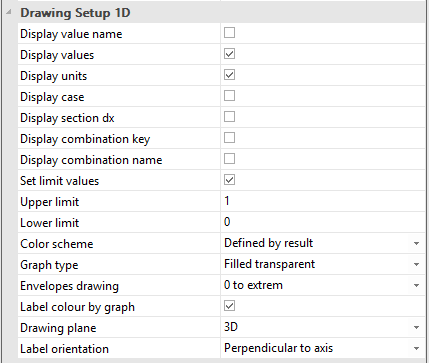
The style of the diagrams may be adjusted in the Drawing setup dialogue. This setup is consistent for all 1D results such as: 1D internal forces, 1D deformations, 1D stresses, Reactions (intensities on linear supports) and 2D results on sections and edges.
Results Info
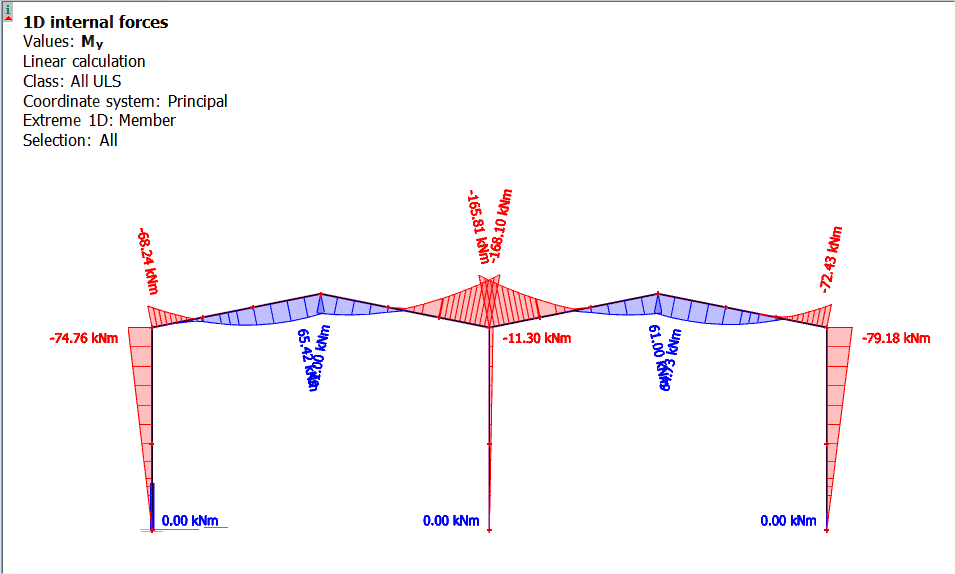
New functionality in version 17.0. enables showing the most important properties that are applied to the displayed result right in the 3D window. It is called Result Info and it is also available to display for images inserted into the Engineering Report. The appearance of Result Info in 3D scene is visible on image below. Additionally, by mouse left click on the icon "i" in the top left corner, the result info may be hidden.
The procedure for the adjustment of display style parameters
-
Select required group (or set) for the display (e.g. Reactions, 1D internal forces, 1D deformations, etc.).
-
The Drawing setup/Drawing setup 1D dialogue is possible to expand in the properties.
-
Set required parameters.
-
Confirm with [Refresh] to view result with changed settings.
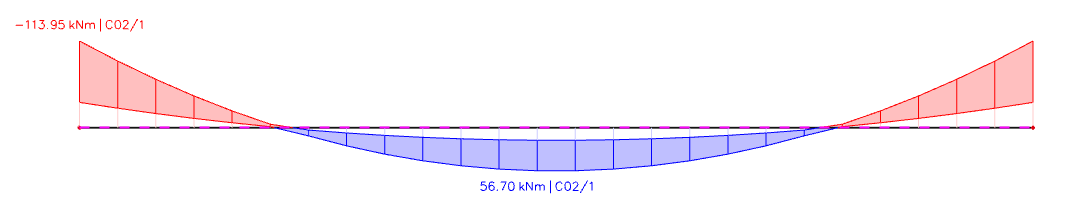
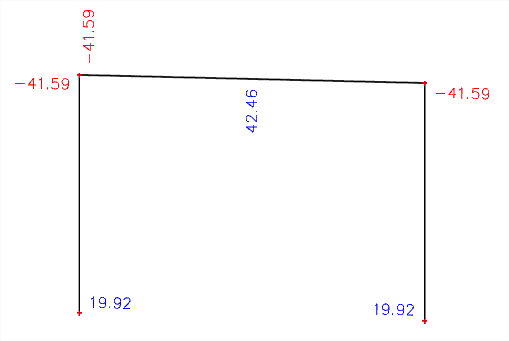
Drawing of result labels
Extreme label has multiple options of enabling different characteristics of the result. Property Display values has to be enabled for other parts of the label to be displayed as well.
Although on following images these labels are displayed for internal forces on beams, the same properties setting applies also to nodal results such as reaction forces, resultant of reactions and nodal displacement.
|
Display value name |
|
|
Display values |
|
| Display units |
|
| Display case | 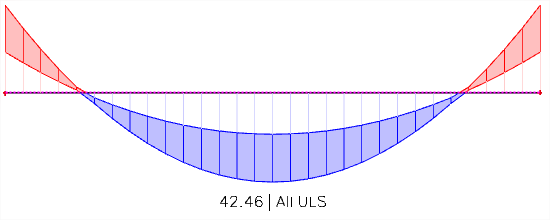
|
|
Display section dx |
|
|
|
|
Display combination name |
|
|
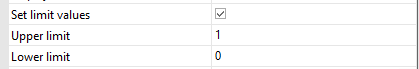
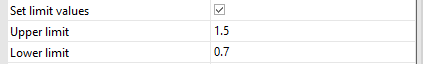
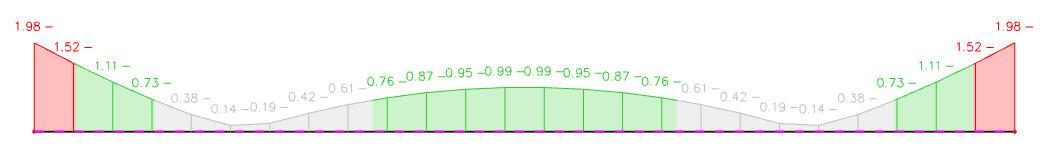
Set limit values |
|
| Set limit values - color change for check |
|
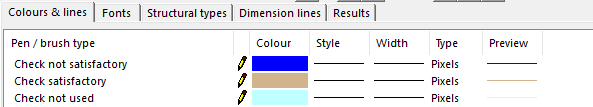
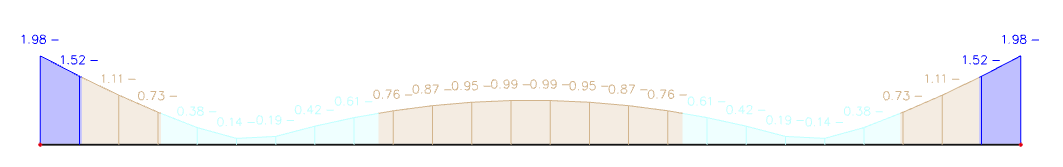
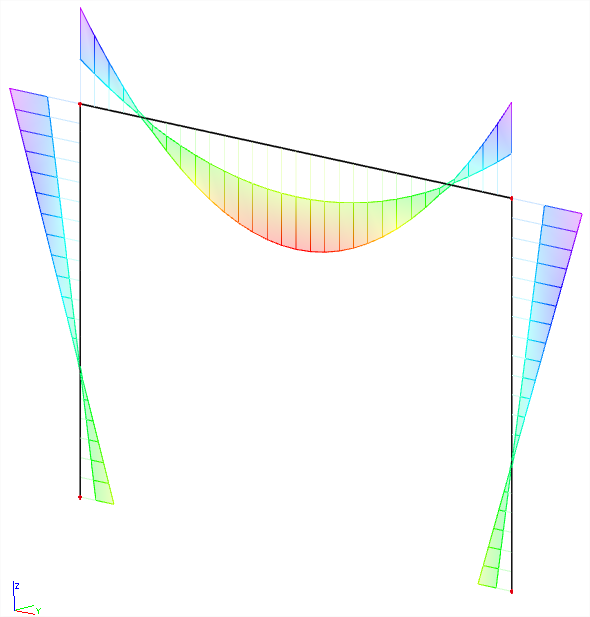
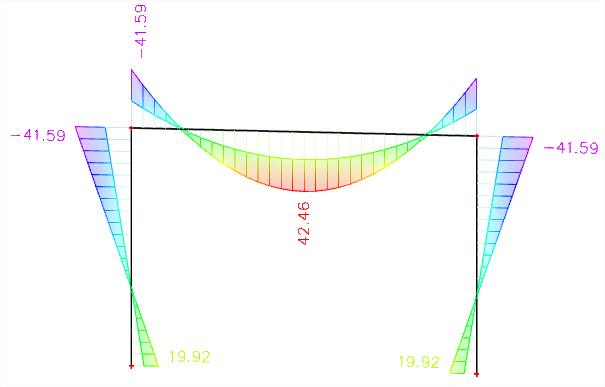
Colour scheme
Different colour schemes may be used to display 1D results
|
One colour |
|
|
Rainbow |
|
|
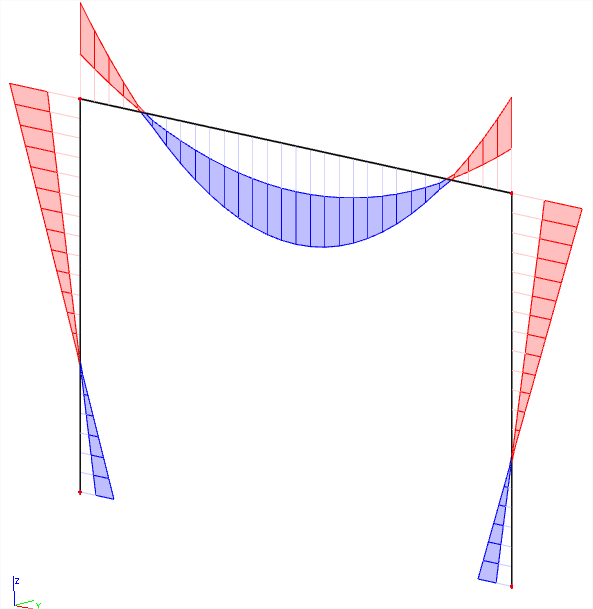
Defined by result |
|
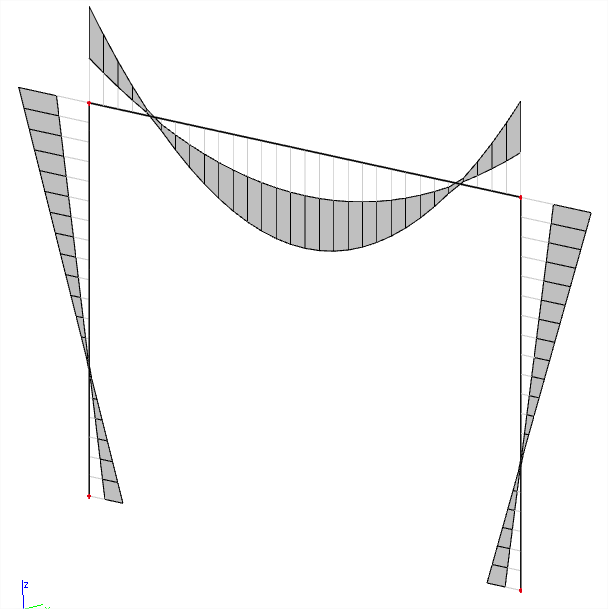
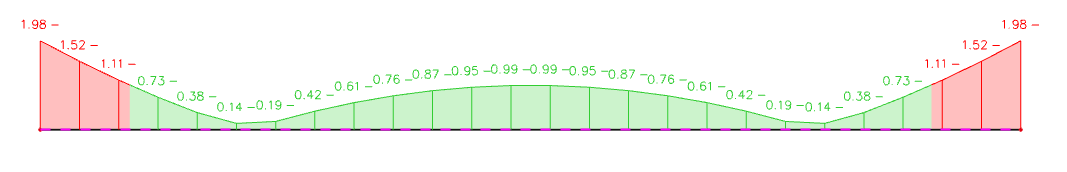
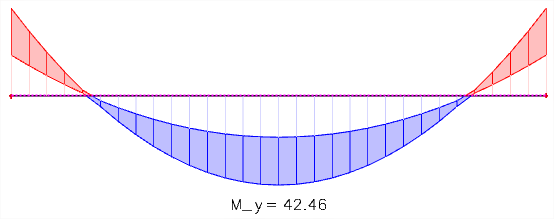
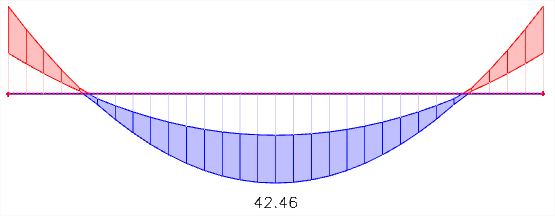
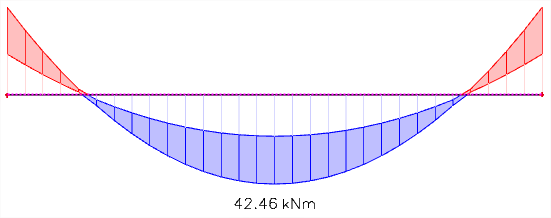
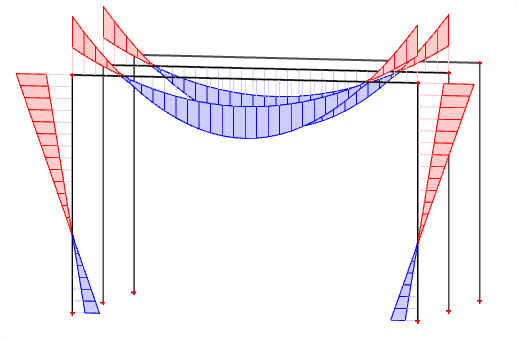
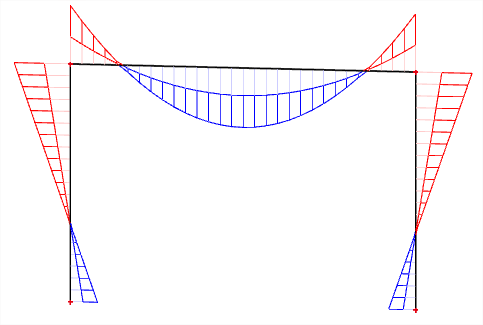
Graph type
|
Base line |
|
|
Graph |
|
| Hatched |
|
| Filled | 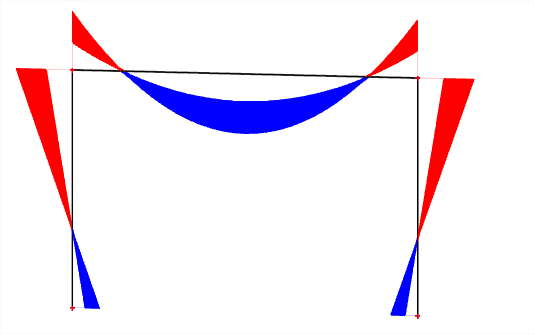
|
|
Filled light (shown on structure with overlapping results) |
|
|
Filled transparent (shown on structure with overlapping results to see the transparent effect) |
|
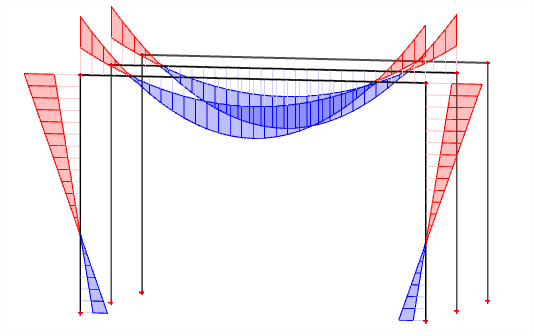
Envelope drawing
Envelopes may be drawn to show both minimal and maximal value of result in each section. If the minimal value of result is not required, setting 0-extreme shows only absolute extreme in each section.
|
0 to extreme |
|
|
min - max |
|
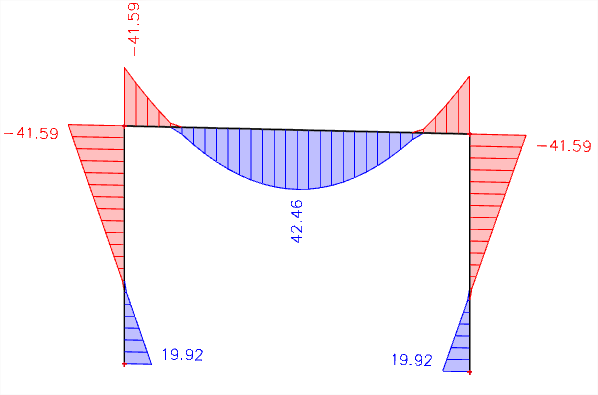
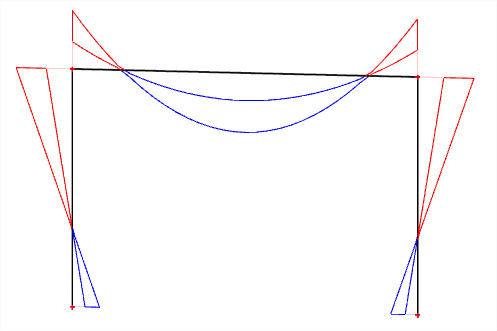
Label coloured by graph
Label may be coloured either by the colour of graph or drawn in one colour (black). When drawn in one colour both the minimal and maximal vales will be drawn in the same style.
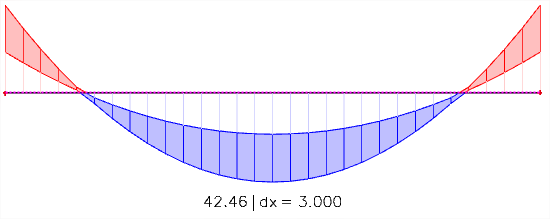
|
Label coloured by graph turned On (shown on results with properties: Envelope drawing: min-max; Colour scheme: Rainbow) |
|
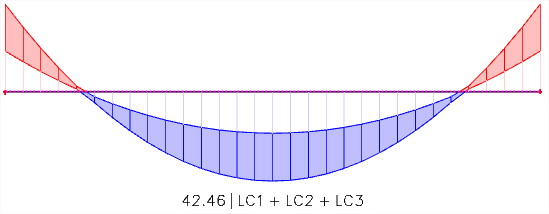
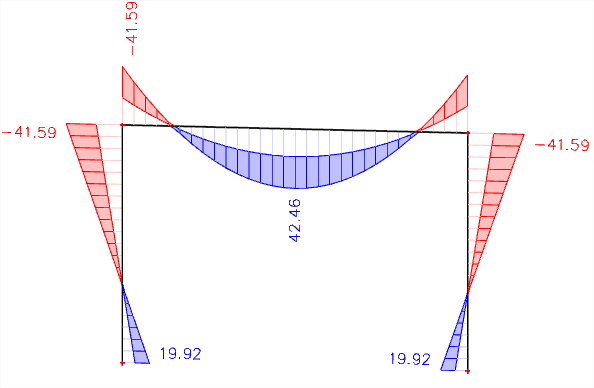
|
Label coloured by graph turned Off (shown on results with properties: Envelope drawing: min-max; Colour scheme: Rainbow) |
|
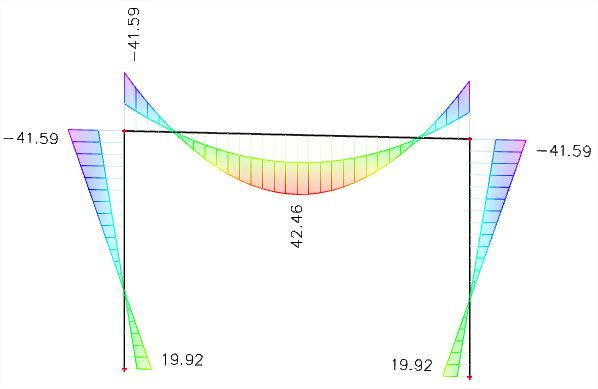
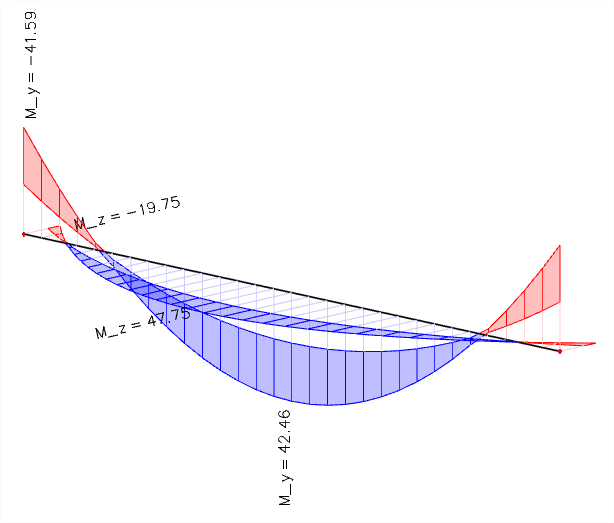
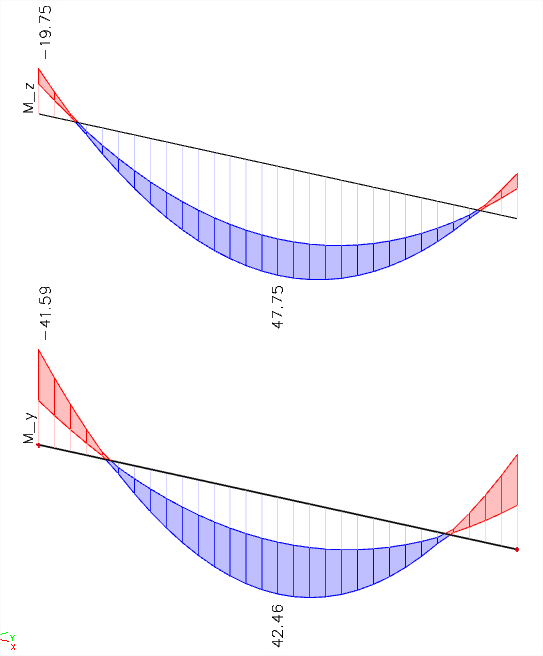
Drawing plane
More component could be displayed by 2 different ways. Displaying more components in 3D allows to clearly see e.g. bending moment in both directions together both drawn in respect of system line of the 1D member.
|
3D |
|
|
Screen |
|