When should IRS analysis be used (or not)?
Contents
- What is IRS analysis?
- In which cases is IRS analysis recommended?
- In which cases is IRS analysis mandatory?
- In which cases must IRS analysis not be used?
What is IRS analysis?
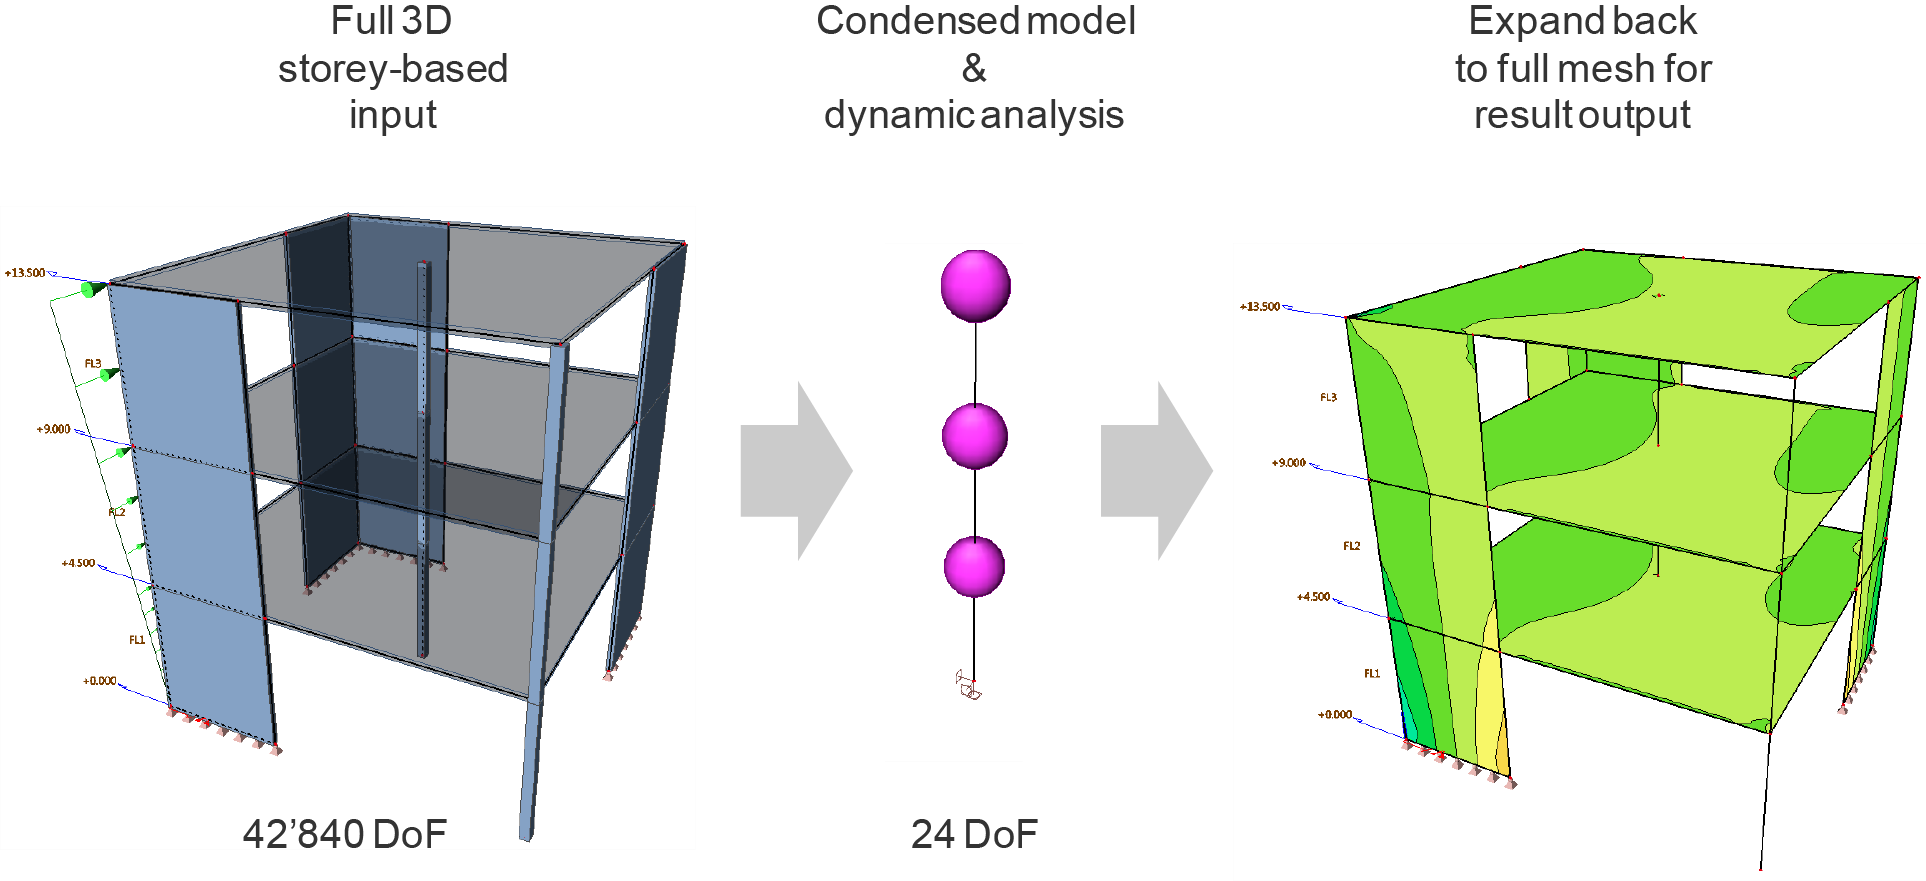
IRS analysis, (aka Improved Reduced System analysis), is a finite element matrix reduction technique used for dynamic analysis of structure. Its implementation in SCIA Engineer is specifically designed for the seismic modal analysis of buildings.
The base principle is assuming, that the seismic behaviour of the structure can be satisfactorily approached by a limited number of degrees of freedom and that the masses attached to each of those DoF behave as rigid or semi-rigid bodies. The reduced system of a building typically consists of one mass per storey. For more details, see the chapter related to the reduced analysis model.
In which cases is IRS analysis recommended?
Using IRS analysis is recommended for buildings that satisfy the basic assumptions of reduced system, i.e. each storey of the building can be satisfactorily considered as a single, rigid or semi-rigid body. Regarding the vertical behaviour, please read the case of potentially problematic vertical behaviour.
Additionally, a benefit of IRS analysis is the elimination of local vibration modes. As the reduced system has only 6 DoF per storey, leading to the implicit aggregation of local modes into overall floor modes. As a consequence - and in case that simplification is acceptable, of course - local modes do not appear individually in the results, the total number of modes is drastically decreased, and the cumulated modal mass ratio is usually much more favourable than in a standard modal analysis (90% of modal mass ratio can be reached with less modes).
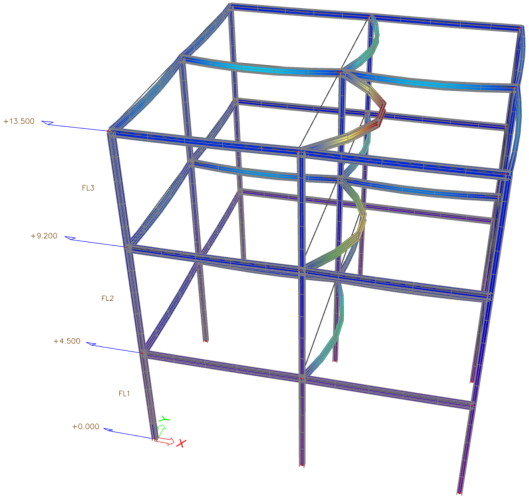
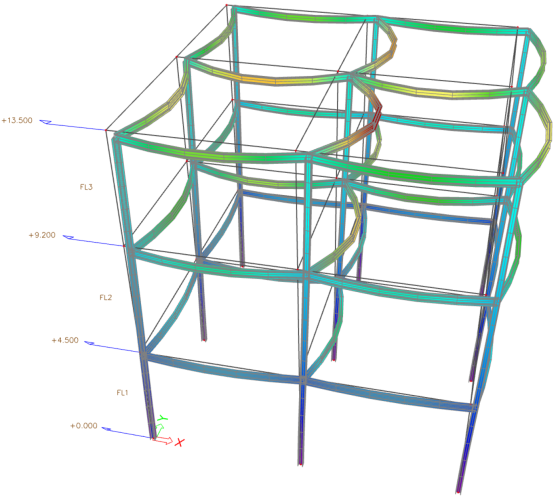
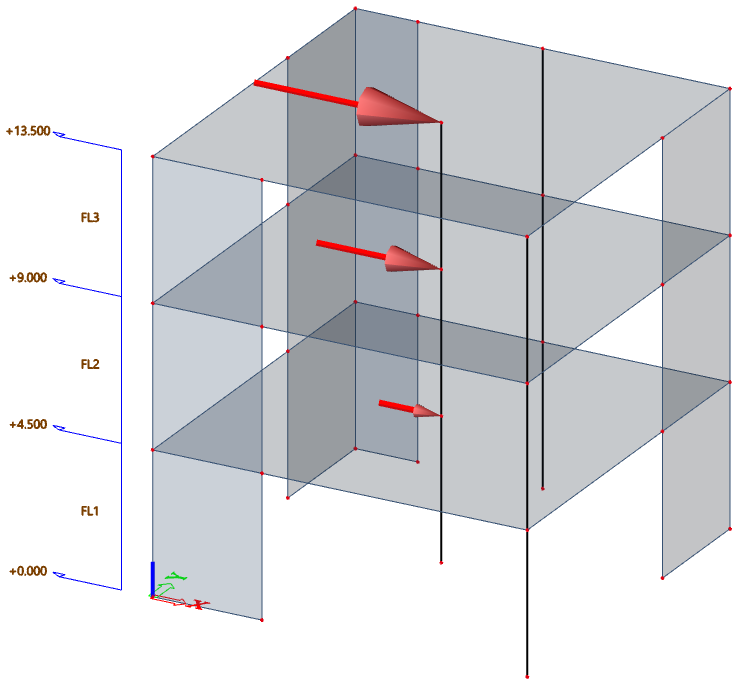
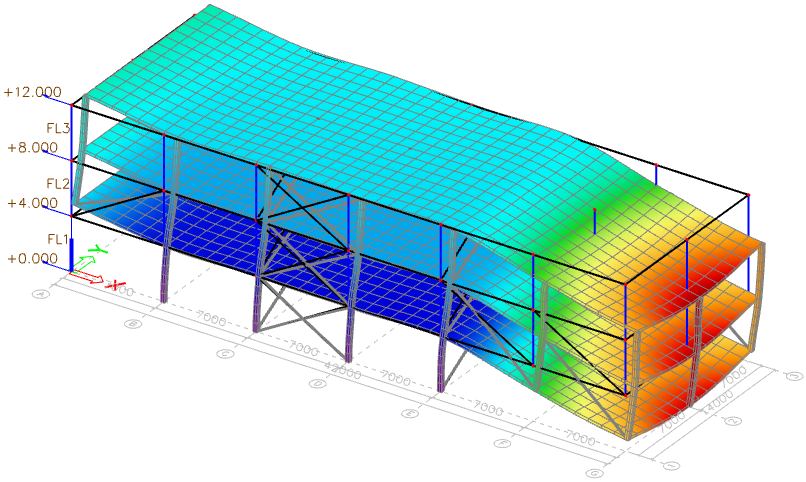
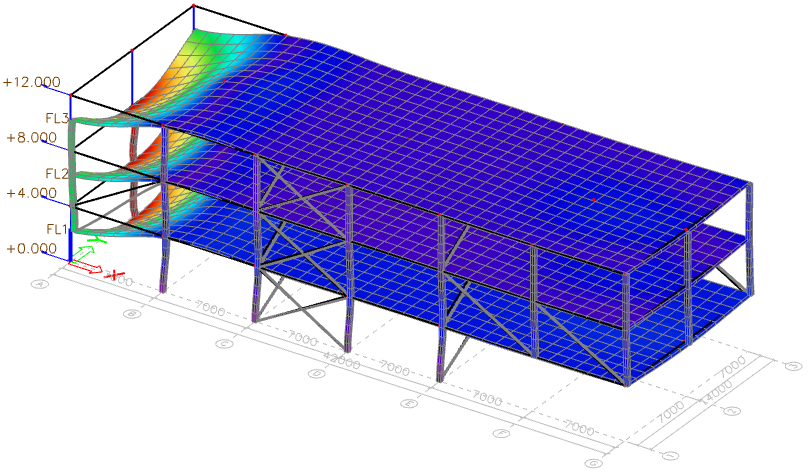
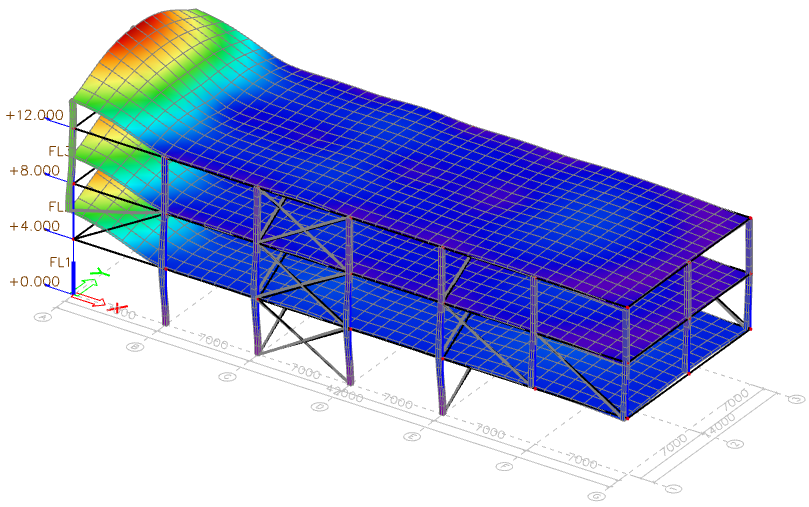
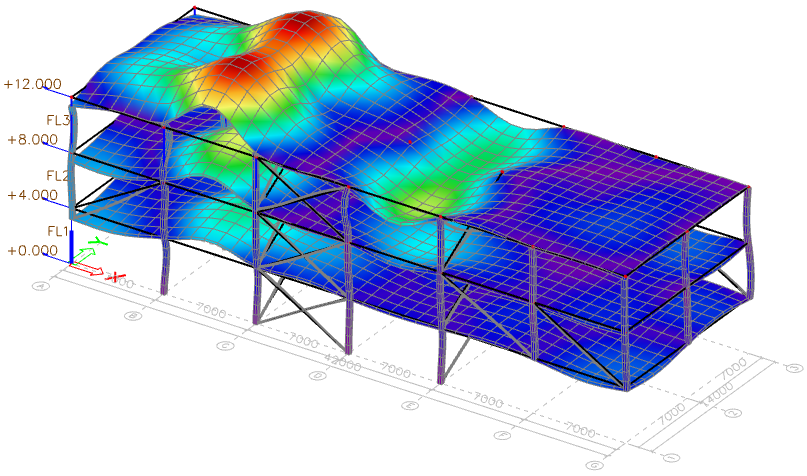
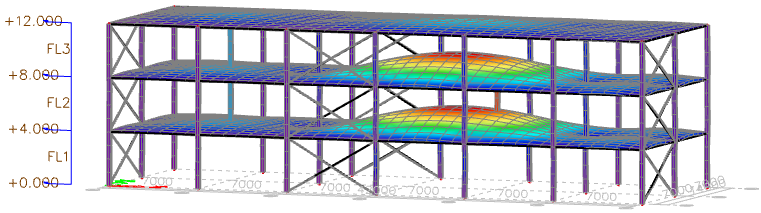
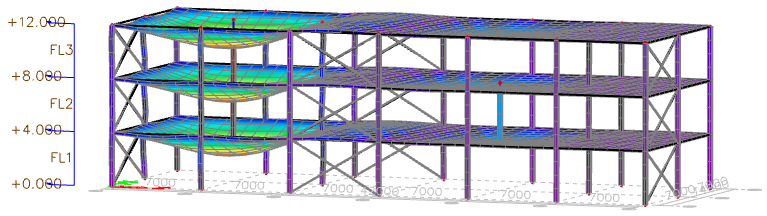
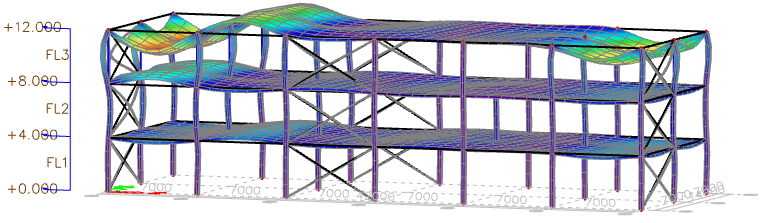
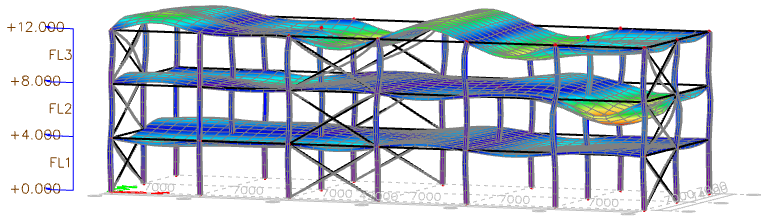
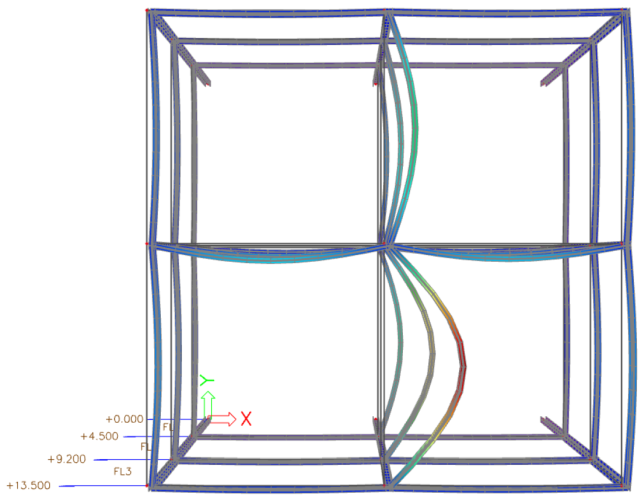
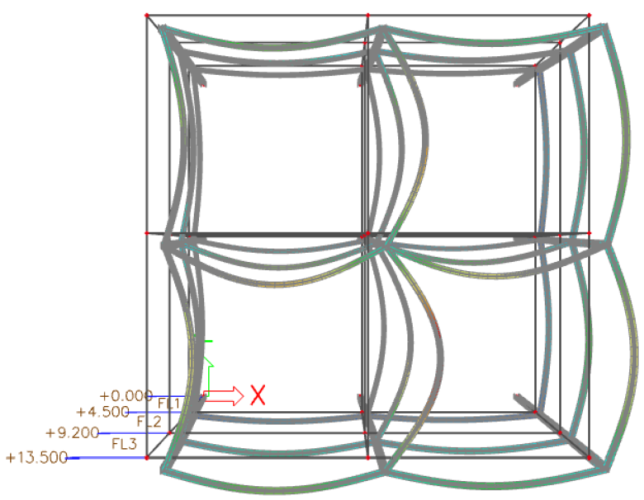
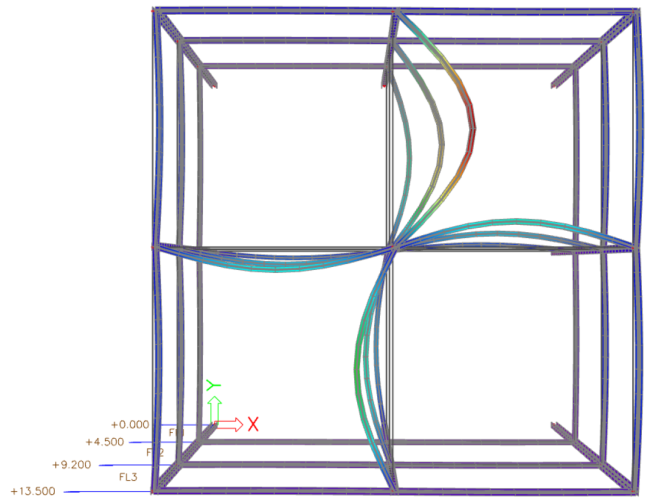
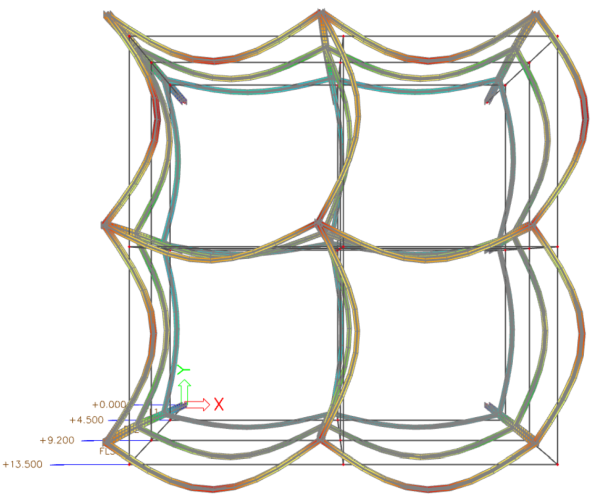
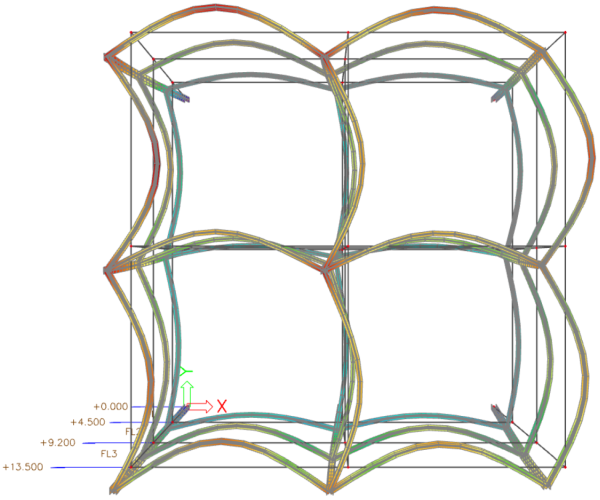
In the example above, the deformed shape on the left-hand side is the fundamental mode obtained from a standard modal analysis. Only part of the beams are deformed, as their local vibration frequency is lower than that of the other beams. In reality, even a very flexible floor would avoid such an isolated behaviour to occur individually. However, because of its low resistance, the floor is not modelled as a diaphragm and the beams are allowed to be deformed individually.
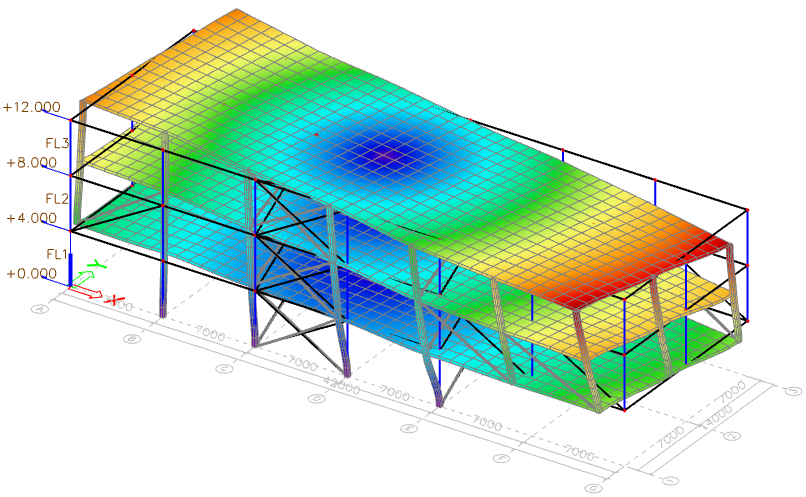
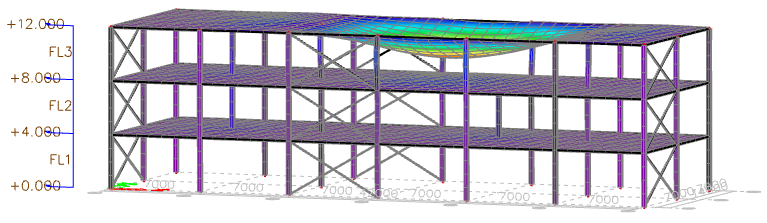
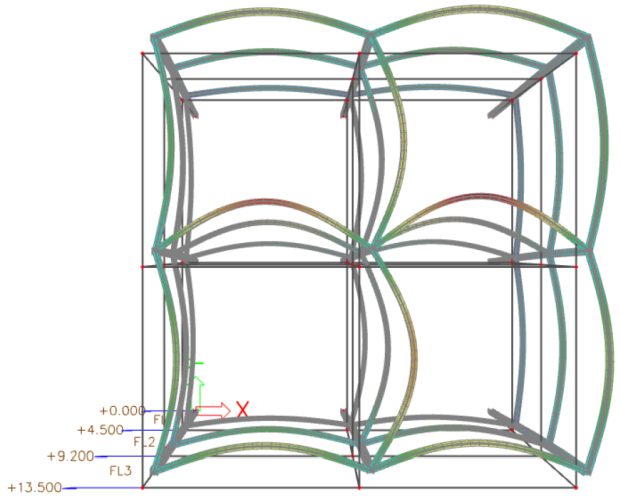
The deformed shape on the right-hand side is the fundamental mode obtained from the same model using IRS analysis. In that case, all beams participate together in the fundamental mode, although their individual vibration frequencies are slightly different. It is exactly what is needed for seismic analysis.
Ultimately, in such cases, the relevance of an IRS analysis is a question to be answered by the author of the project. If the aggregation of local modes is a desired behaviour and the real structure will tend to enforce it, typically by the presence of structural parts that have been ignored in the model, then IRS analysis is likely to be appropriate. Significant discrepancies between IRS and standard modal analysis might also be interpreted as a sign, that the model is too coarse and that structural parts with a significant impact have been inappropriately ignored. See a more detailed discussion below about this example (flexible structures without diaphragm).
The example above is very simple. In complex truss structures, the number of irrelevant local modes can increase very rapidly.
Please note, that IRS analysis is usually not suitable for floor vibration analysis, where a detailed evaluation of local behaviours is needed.
Irrelevant local modes may also be eliminated by other techniques, such as concentrating specific masses at the nodes of the model instead of distributing them along members.
In which cases is IRS analysis mandatory?
Some features of SCIA Engineer related to seismic analysis require using the reduced system.
As explained in the chapter related to the reduced analysis model, the conversion that is used to produced the reduced system from the full mesh of the structure can be used backward to convert point forces or moments applied at the mass center of each storey into equivalent distributed forces applied to the original finite element mesh. That technique is used to apply to the model the equivalent static forces and moments used in the case of accidental eccentricity and equivalent lateral forces.
In order to use seismic accidental eccentricity or seismic equivalent lateral forces (ELF) analysis in SCIA Engineer, storeys must be defined and IRS analysis must be enabled in the solver settings.
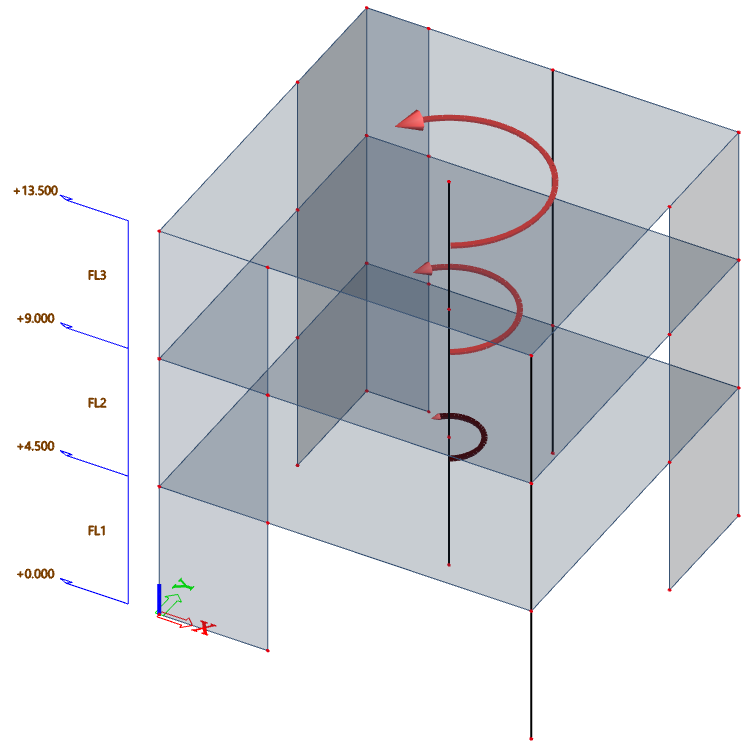
Accidental eccentricity
The effect of accidental eccentricity is taken into account by applying moments around the vertical (GCS Z) axis. The value of the concentrated moment is calculated for each storey and distributed to the finite element mesh using IRS backward conversion. More information in the chapter related to accidental eccentricity.
Equivalent lateral forces (ELF)
The equivalent lateral forces of the ELF method are calculated for each storey. They are then applied and distributed to the finite element mesh using IRS backward conversion. More information in the chapter related to the ELF method.
In which cases must IRS analysis not be used?
This might be an obvious statement, but it is certainly worth mentioning it again here: buildings, that do not satisfy the basic assumption of the reduced system should not be calculated using IRS analysis. See the following examples.
Buildings with multiple bodies
Buildings where some parts can have independent, significant seismic behaviour should not be calculated using IRS analysis. As in IRS analysis each storey is simulated using only one reduction point, independent behaviours of parts of a same storey cannot be considered correctly.
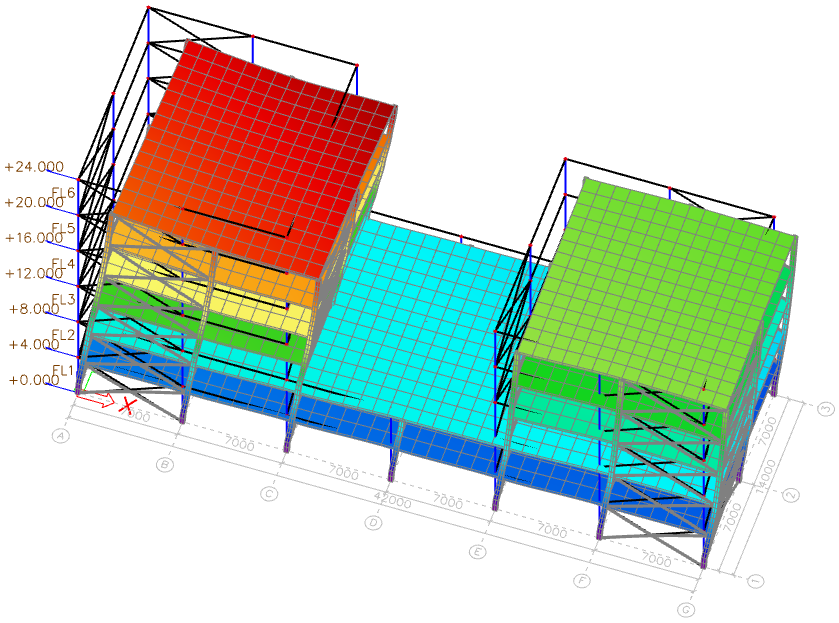
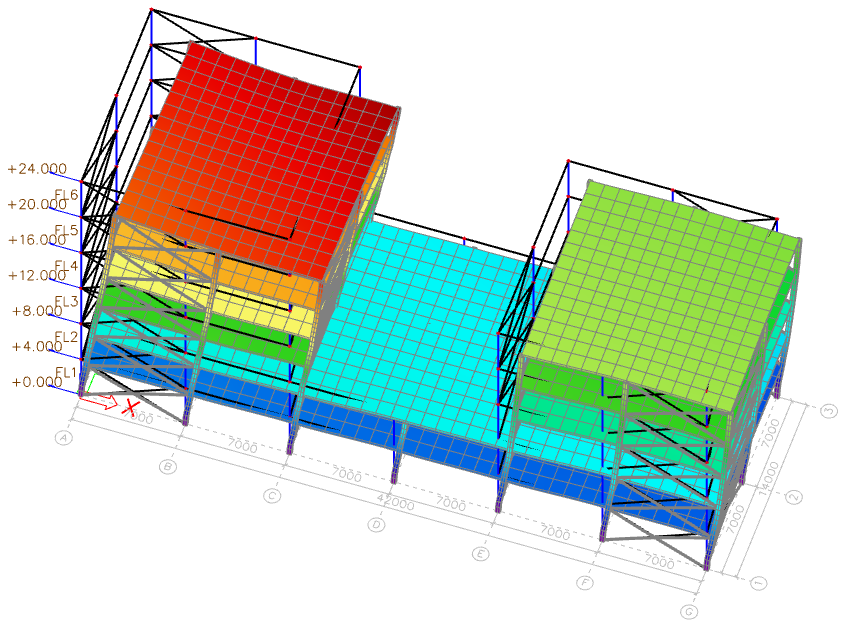
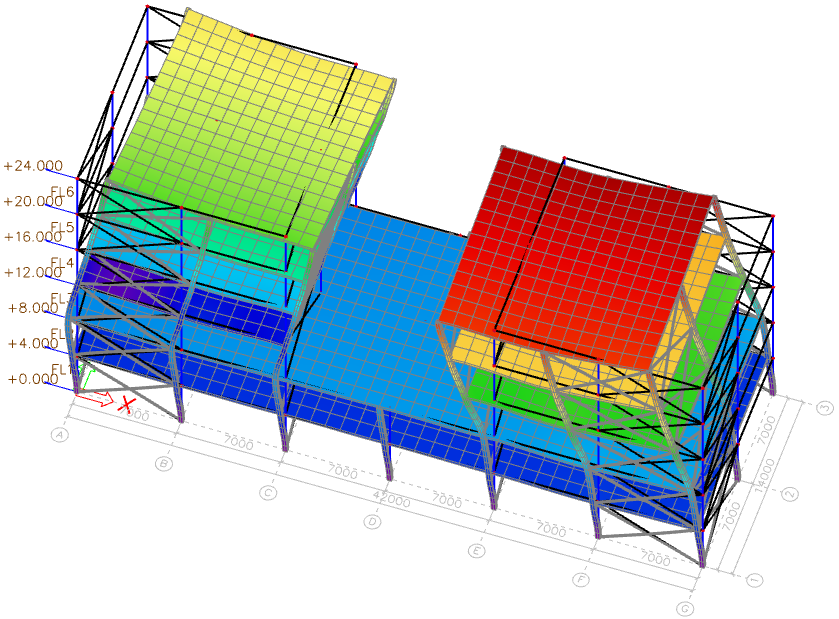
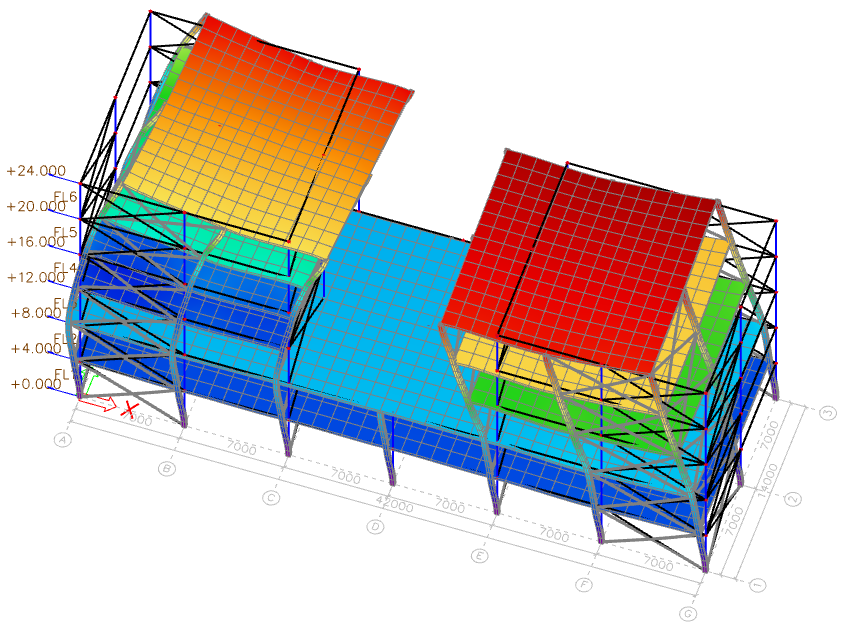
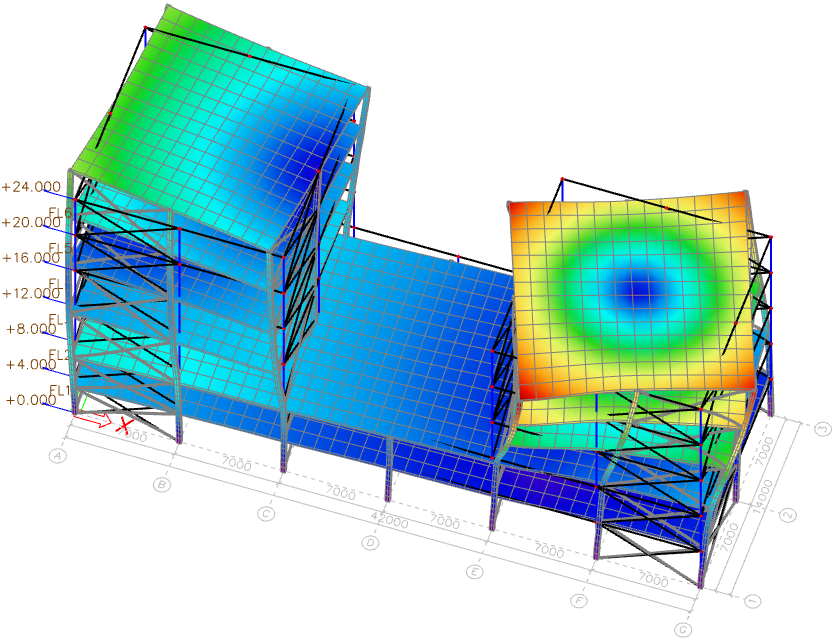
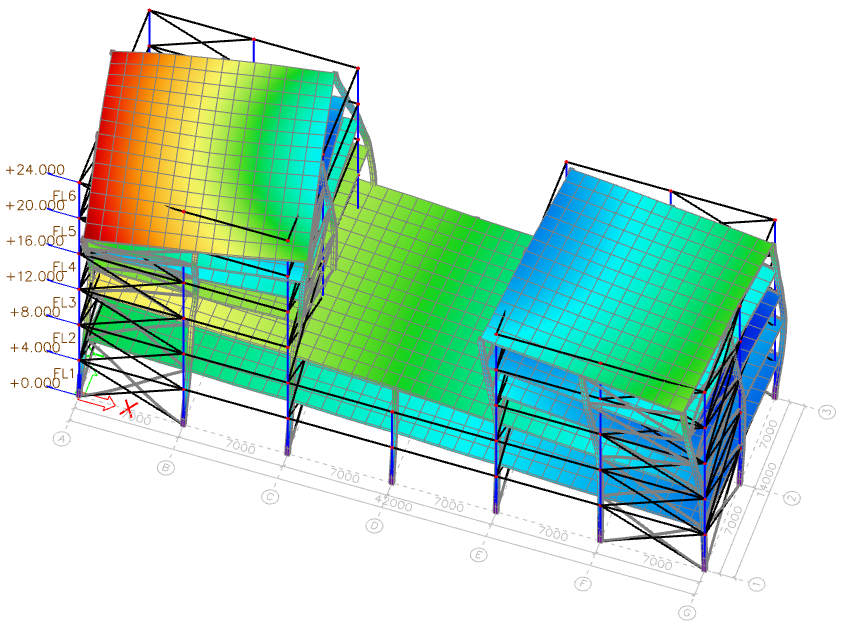
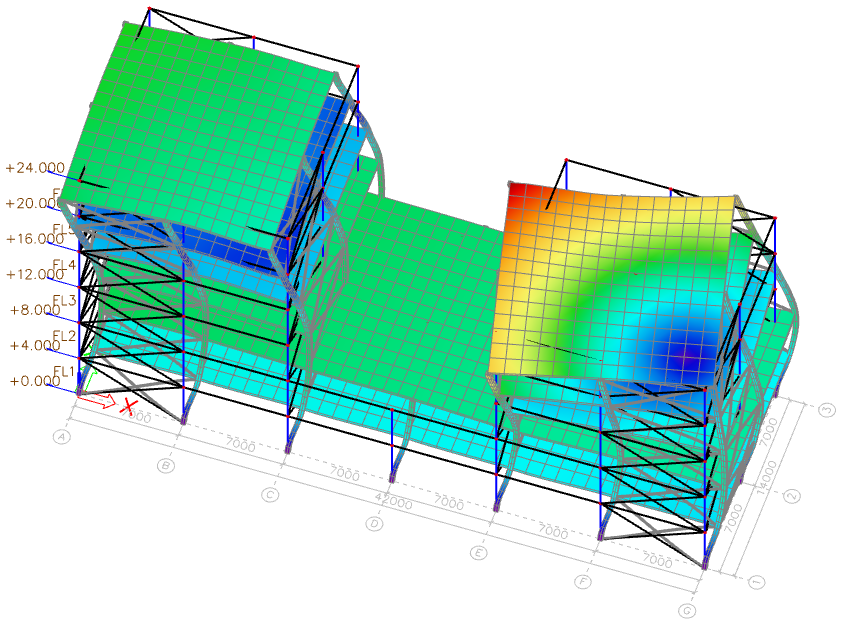
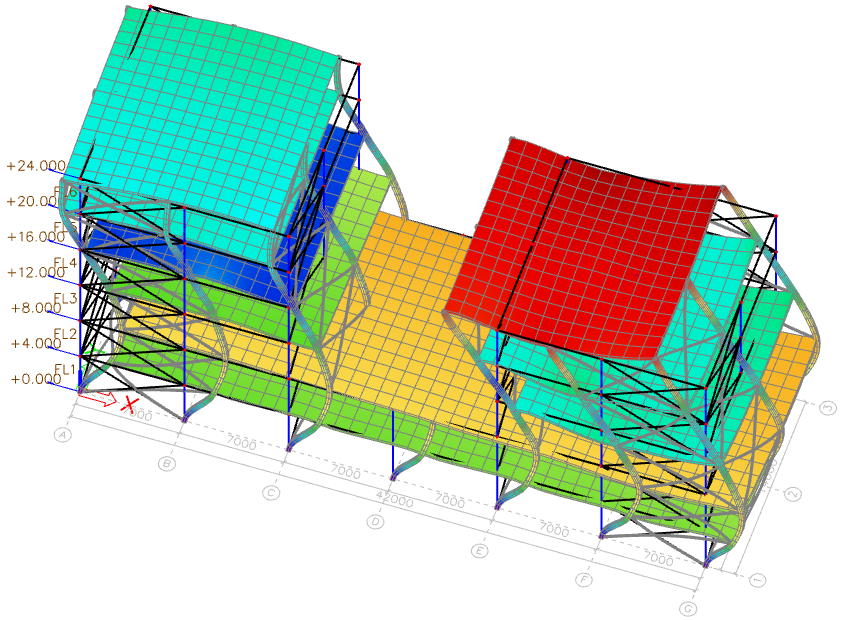
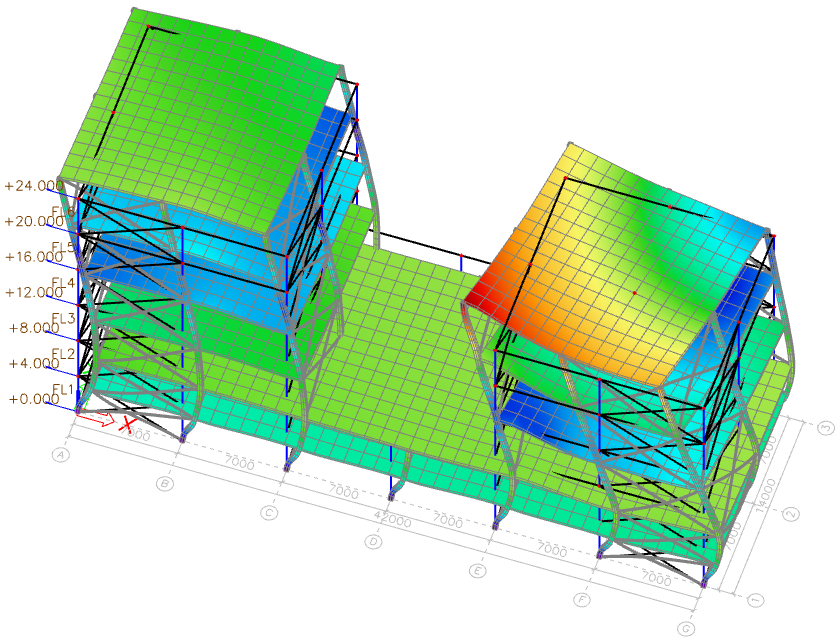
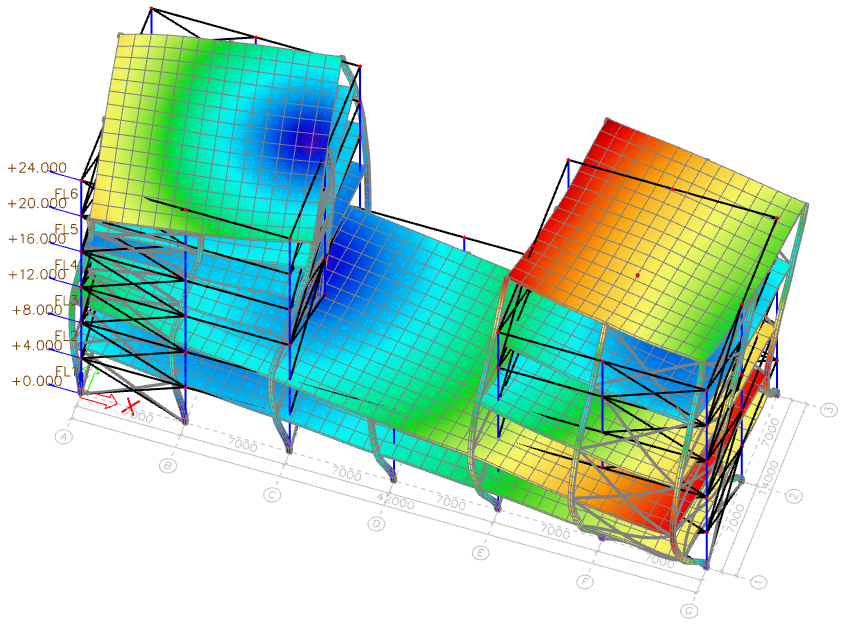
Example: building with two separate towers
In the example below, two separate towers are built atop a common two-storey lower part. Each tower can exhibit behaviours that are independent from the other.
In order to represent correctly the behaviour of such a structure, the reduced system would need to have 2 reduction points per storey - one for each tower - for the 4 upper floors. That is currently not supported in SCIA Engineer.
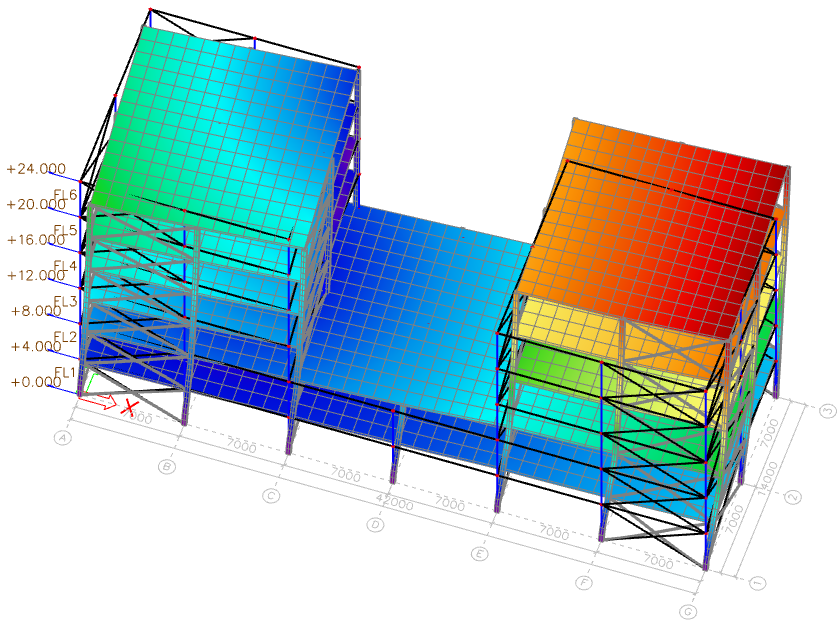
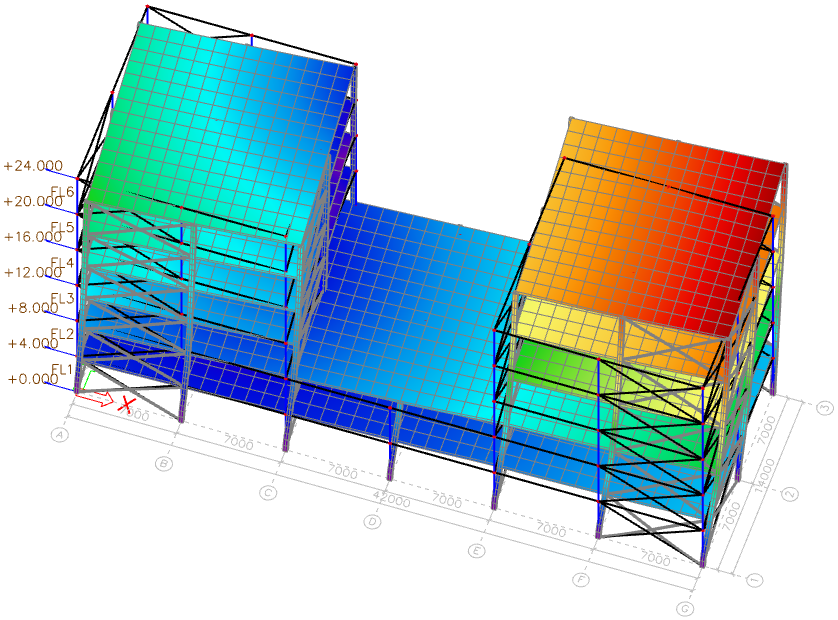
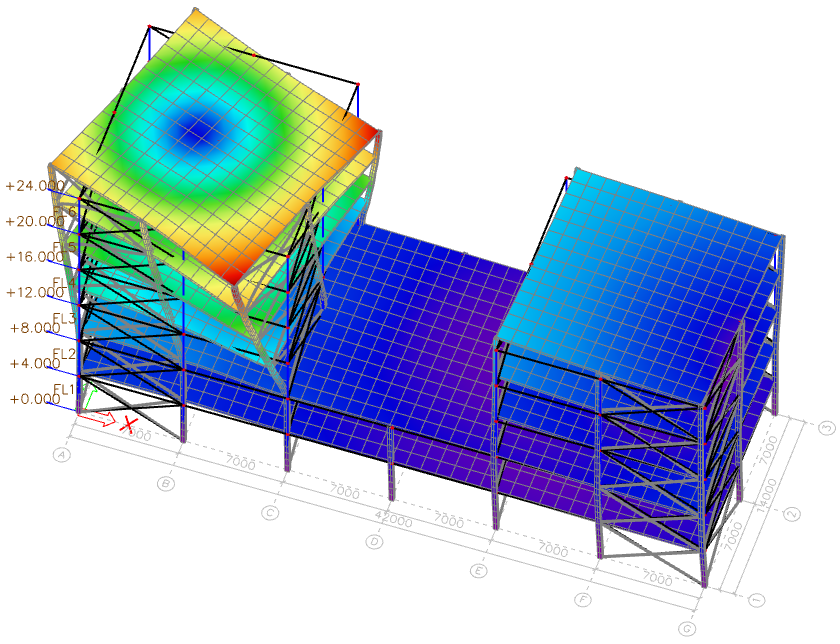
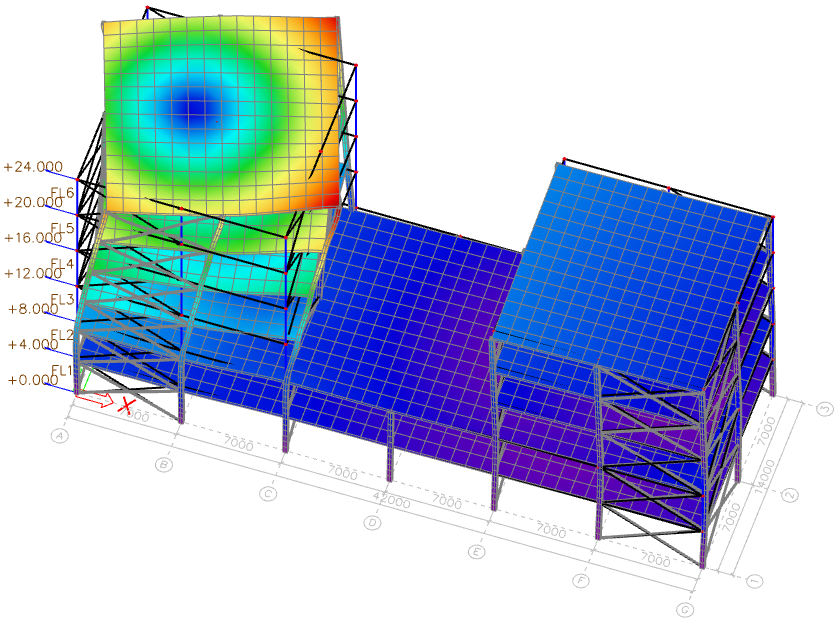
For the first 5 modes, which most exhibit fairly close frequencies and modal mass participation ratios, the mode shapes are very similar - apart from sign changes in some case, which is anyway irrelevant for their purpose.
Significant discrepancies appear from mode 6, both in frequency and modal participation ratios. Also, the mode shapes are clearly dissimilar. That can be a problem, as modal mass participation ratios are still significant in some cases (modes 7 and 8 in standard analysis, modes 6 and 7 in IRS analysis). Ignoring the disrupting modes is not a satisfying solution, as the modes that have consistent behaviours do not reach a combined modal mass participation ratio of 90%. There is therefore no guarantee, that the reduced model will produce meaningful results.
| Standard analysis (original mesh) | IRS analysis | ||||||
| Mode | f [Hz] | Wxi/Wxtot | Wyi/Wytot | Mode | f [Hz] | Wxi/Wxtot | Wyi/Wytot |
| 1 | 0.969 | 18.8% |
37.3% |
1 | 0.970 | 18.6% | 37.8% |
|
|
||||||
| 2 | 1.036 | 51.5% | 21.0% | 2 | 1.037 | 52.4% | 20.6% |
|
|
||||||
| 3 | 1.252 | 0.9% | 19.0% | 3 | 1.254 | 1.1% | 19.0% |
|
|
||||||
| 4 | 1.557 | 8.0% | 0.8% | 4 | 1.695 | 8.5% | 0.6% |
|
|
||||||
| 5 | 2.127 | 0.0% | 1.1% | 5 | 2.198 | 0.0% | 1.4% |
|
|
||||||
| 6 | 2.743 | 0.0% | 1.7% | 6 | 2.918 | 0.0% | 12.7% |
|
|
||||||
| 7 | 2.974 | 6.2% | 7.9% | 7 | 3.140 | 15.4% | 0.1% |
|
|
||||||
| 8 | 3.016 | 9.7% | 5.7% | 8 | 3.520 | 0.2% | 3.5% |
|
|
||||||
| Total 10 modes | 95.3% | 95.8% | Total 10 modes | 96.2% | 95.9% | ||
Buildings with complex, deformable diaphragms
Due to the in-plane geometry of its slabs, significant modes involving predominant in-plane deformations of the slabs can appear. Moreover, the frequency of such mode may be within the relevant range for seismic analysis.
As the reduced system uses only one reduction point per storey, only three degrees of freedom are available to represent the horizontal displacement behaviour of each storey: translations in X and Y directions and rotation around Z axis. This essentially means, that, in principle, only 2 translational and 1 rotational mode can be represented for each storey. Internal modes won't appear in the results, unless they are combined with some other represented behaviour.
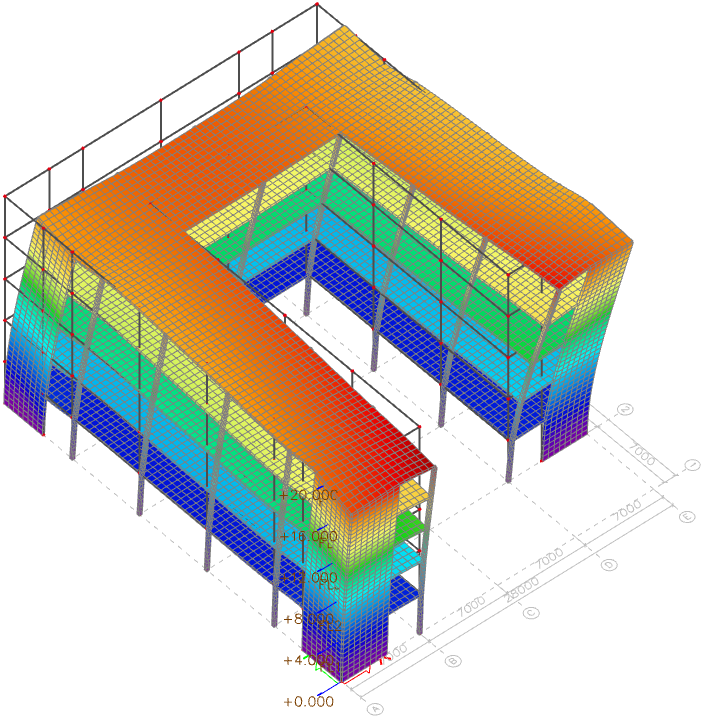
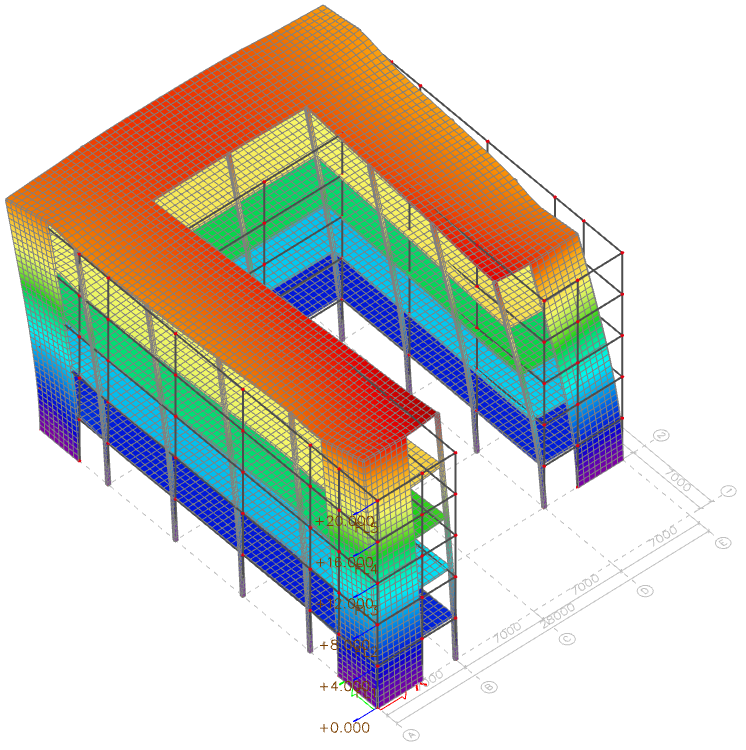
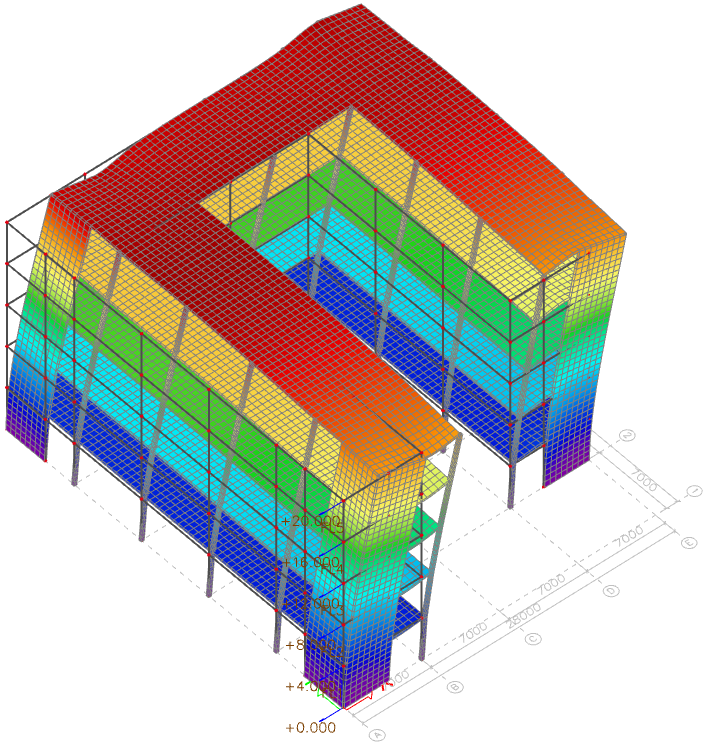
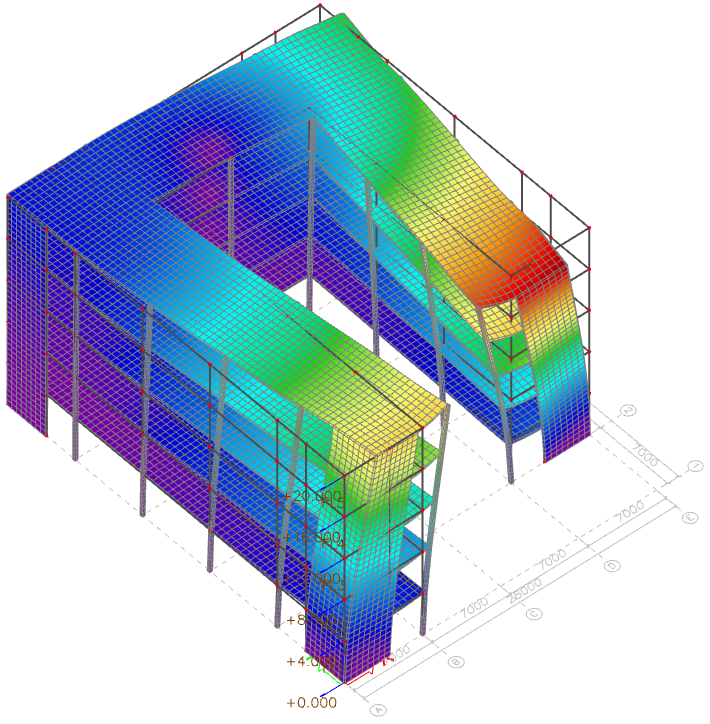
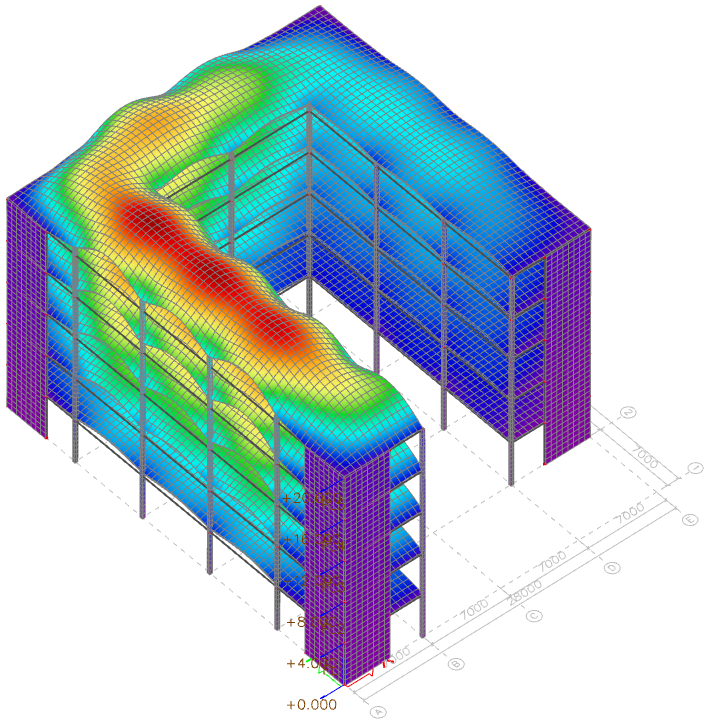
Example: U-shaped building
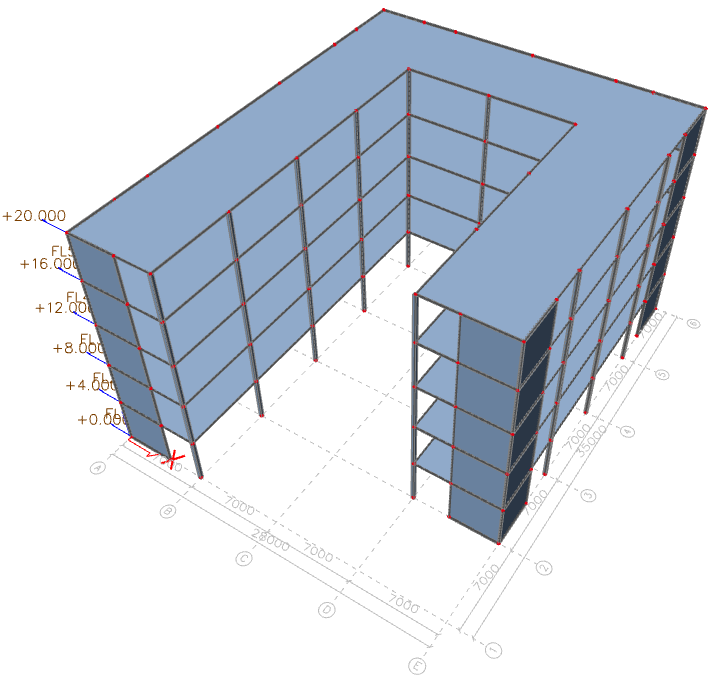
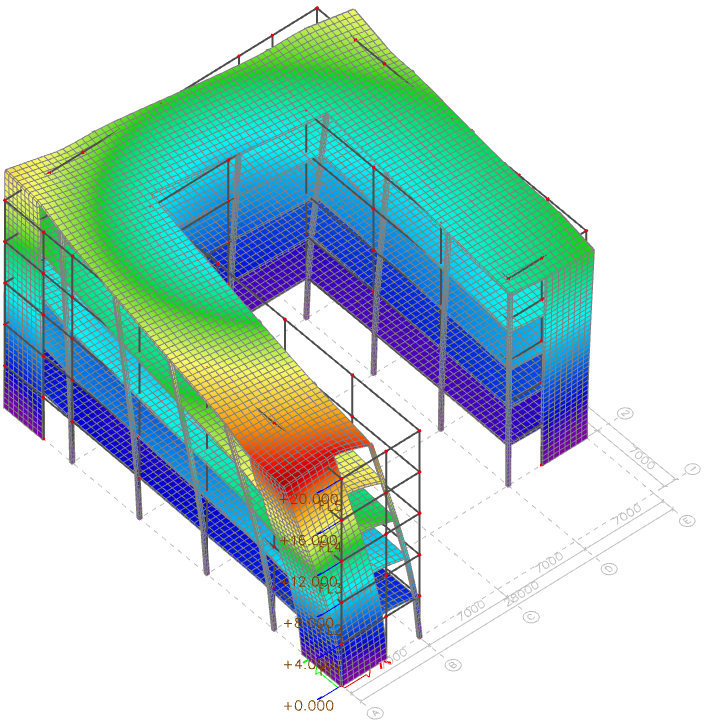
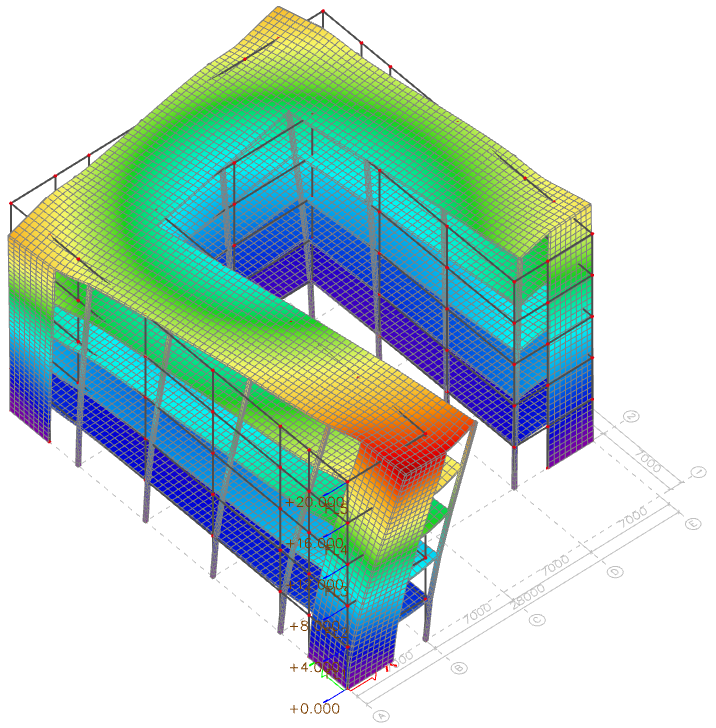
In this example, the first 3 modes (translation in Y direction, in X direction and overall rotation around Z axis) match quite well for frequency, modal mass ratio and mode shape. Changes of sign might occur, which does not affect the final results (modes 1 and 3). The small difference in the modal mass ratio, however, shows that there is a difference in the mode shape for mode 1, due to an discrepancy in the in-plane deformation of the decks.
Mode 4 (standard analysis), which is typical for that type of geometry, has a low modal mass ratio (4%), but is nevertheless not negligible. That mode is simply missing in the IRS analysis. The reduced system is unable to produce it because of the lack of appropriate degrees of freedom.
| Standard analysis (original mesh) | IRS analysis | ||||||
| Mode | f [Hz] | Wxi/Wxtot | Wyi/Wytot | Mode | f [Hz] | Wxi/Wxtot | Wyi/Wytot |
| 1 | 2.033 | 0.0% | 64.1% | 1 | 2.043 | 0.0% | 65.6% |
|
|
||||||
| 2 | 2.212 | 68.4% | 0.0% | 2 | 2.212 | 68.4% | 0.0% |

|
|
||||||
| 2.212 | 3.950 | 0.0% | 0.5% | 3 | 3.970 | 0.0% | 0.2% |
|
|
||||||
| 4 | 4.661 | 0.0% | 4.1% | 4 | 5.232 | 0.0% | 0.0% |
|
|
||||||
| Total 10 modes | 68.4% | 68.8% | Total 10 modes | 68.5% | 65.9% | ||
In order to represent correctly the behaviour of such a structure, the reduced system would need to have 2 reduction points per storey - one for each branch of the building. From a strictly theoretical point of view, IRS analysis could handle it, but such use cases are currently not supported in SCIA Engineer.
Buildings with potentially problematic vertical behaviour
The vertical behaviour of a building may be represented correctly by the reduced system, up to a certain point. Typically, if all bays of a floor have similar span length and masses, a single mode may catch satisfactorily the vertical dynamic behaviour of that floor. Thanks to the two rotational degrees of freedom around the X and Y axes, mode shapes that involve antimetrical behaviour of slabs may be represented correctly as well. However, be aware, that only 3 degrees of freedom per floor are available, that are related to that type of behaviour. As a consequence, no more than 3 such mode shapes may be represented correctly. If more are necessary to cover the entire behaviour of the structure, those modes are likely to be aggregated by the IRS analysis, leading to an approximation.
As a general rule, for structures, where the vertical dynamic behaviour might be critical and is not clearly governed by a small enough number of modes, using an IRS analysis should be validated. This can be done by running the modal analysis with both standard and IRS analysis and comparing the modal results (frequencies, modal mass ratios, mode shapes).
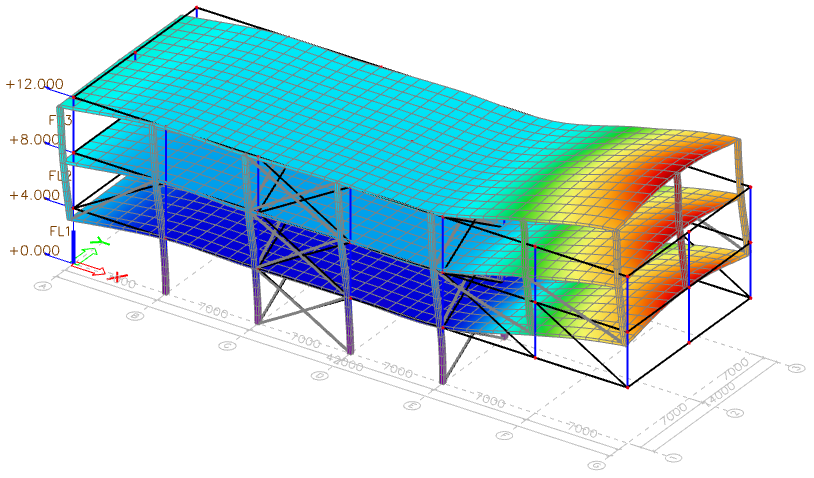
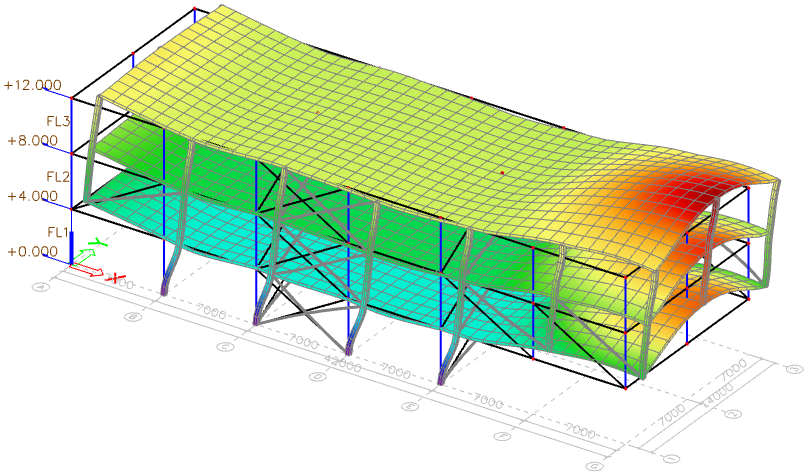
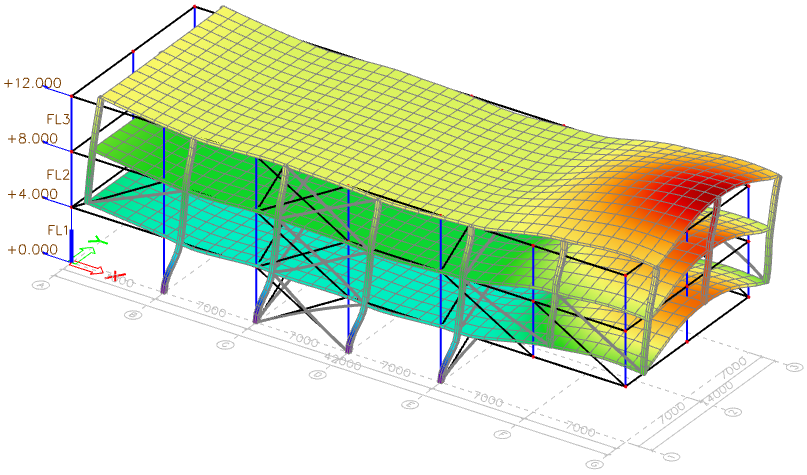
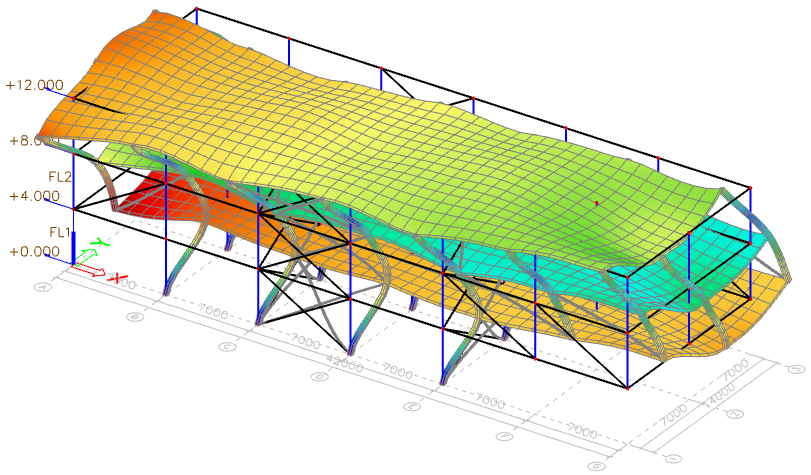
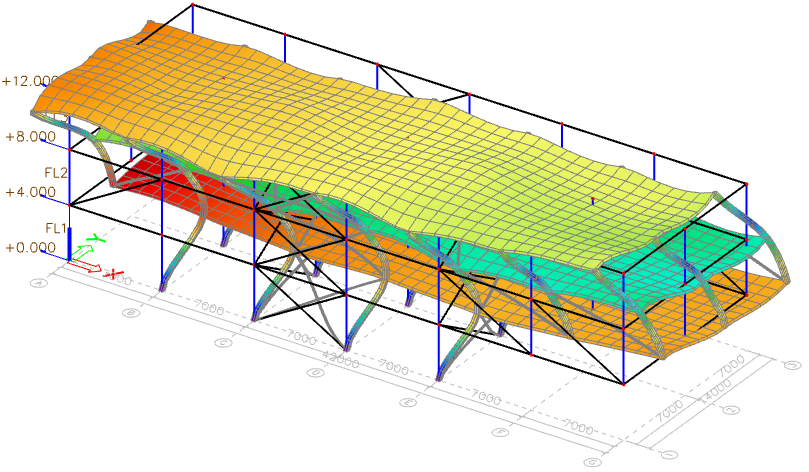
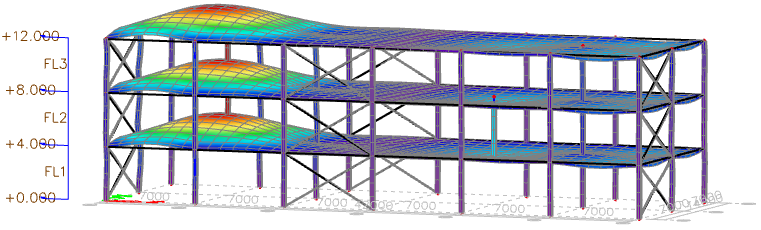
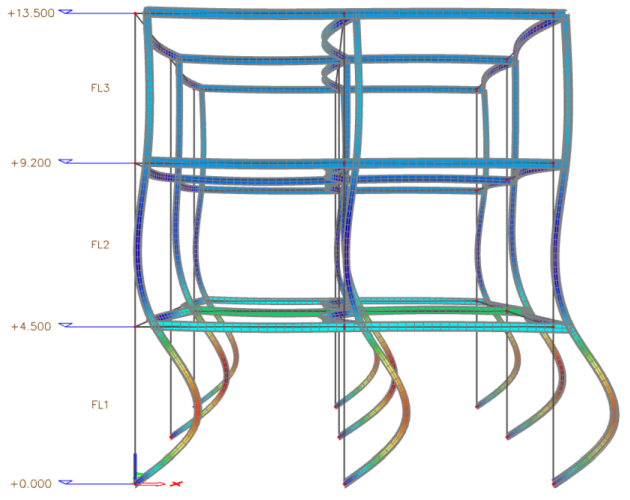
Example 1: structure with large cantilevers
The following structure exhibits large cantilevers on two of its sides. It is a seismically quite poor design, however, the purpose of this example is to illustrate, that such structure should not be calculated using IRS analysis.
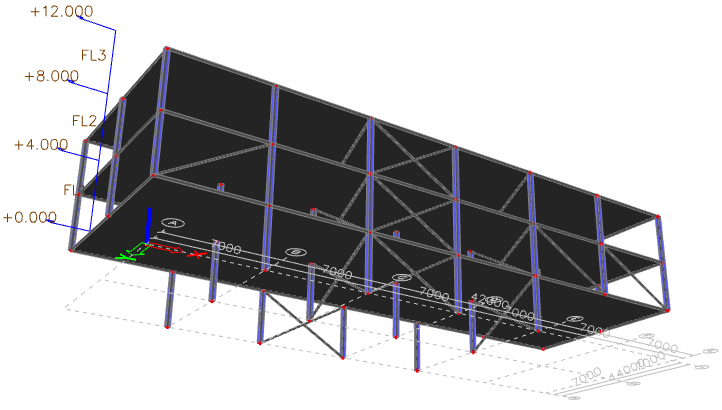
The decks are all compact and a priori well suited for IRS analysis for the horizontal behaviour. However, because of the large cantilevers, strong vertical components are to be expected and, most importantly in this case, coupling between horizontal and vertical behaviours. That coupling is already clearly visible in the first mode, which combines significant modal mass ratio values in both X and Z directions. As a consequence, the vertical behaviour of the structure also affects its horizontal behaviour.
| Standard analysis (original mesh) | IRS analysis | ||||||||
| Mode | f [Hz] | Wxi/Wxtot | Wyi/Wytot | Wzi/Wztot | Mode | f [Hz] | Wxi/Wxtot | Wyi/Wytot | Wzi/Wztot |
| 1 | 0.904 | 18.7% | 0.1% | 14.6% | 1 | 0.908 | 19.3% | 0.1% | 14.7% |
|
|
||||||||
| 2 | 1.067 | 0.0% | 1.8% | 0.0% | 2 | 1.068 | 0.0% | 1.8% | 0.0% |
|
|
||||||||
| 3 | 1.253 | 0.2% | 86.4% | 0.1% | 3 | 1.254 | 0.2% | 86.4% | 0.1% |
|

|
||||||||
| 4 | 1.436 | 69.0% | 0.6% | 8.3% | 4 | 1.447 | 69.5% | 0.5% | 8.8% |
|
|
||||||||
| 5 | 2.178 | 4.1% | 0.0% | 12.6% | 5 | 2.416 | 3.2% | 0.0% | 26.9% |
|
|
||||||||
| 9 | 3.612 | 0.9% | 8.0% | 0.2% | 8 | 3.627 | 1.0% | 8.0% | 0.1% |
|
|
||||||||
| 10 | 3.685 | 4.8% | 0.9% | 0.5% | |||||
|
missing | ||||||||
| 25 | 5.28 | 0.0% | 0.0% | 36.5% | |||||
|
missing | ||||||||
| 26 | 5.31 | 0.0% | 0.0% | 4.7% | |||||
|
missing | ||||||||
| Total 50 modes | 99.9% | 100.0% | 93.8% | Total 24 modes | 99.8% | 99.8% | 51.5% | ||
There is a quite good correspondence between the standard and IRS analyses for the first 4 modes (frequencies, modal mass ratios and mode shapes).
In mode 5, divergence becomes apparent, both in the frequency and in the modal mass ratio.
The correspondence is good again in mode 9 (8 for IRS), but that the end of it. All following significant modes of the standard analysis are simply missing in the IRS results.
Most importantly, keep in mind, that IRS analysis produces approximate mode shapes - which consequently affects the modal mass ratios. The quality of the results is good for fundamental modes, which are usually the relevant ones for seismic analysis. Higher frequency modes might diverge from the standard solution. It is usually not a major issue, as those modes are not significant for the seismic analysis.
In theory, the sum of modal mass ratios for all modes of the structure should be equal to 1. In IRS analysis, that statement is not necessarily true, because mode shapes on the original FE mesh are approximate.
In cases like this one, where IRS analysis is not suitable, the total modal mass ratio for 24 modes (i.e. all modes in the case of our IRS analysis with a 4-nodes reduced system), is only 51.5% ! As all modes of the reduced system have been computed, it should be 100%, in theory.
When all modes are computed in an IRS analysis, it is a good thing to check, that the cumulated modal mass ratio is around 100% in all directions. Not satisfying this condition is a sign of poor quality of the results of the IRS analysis.
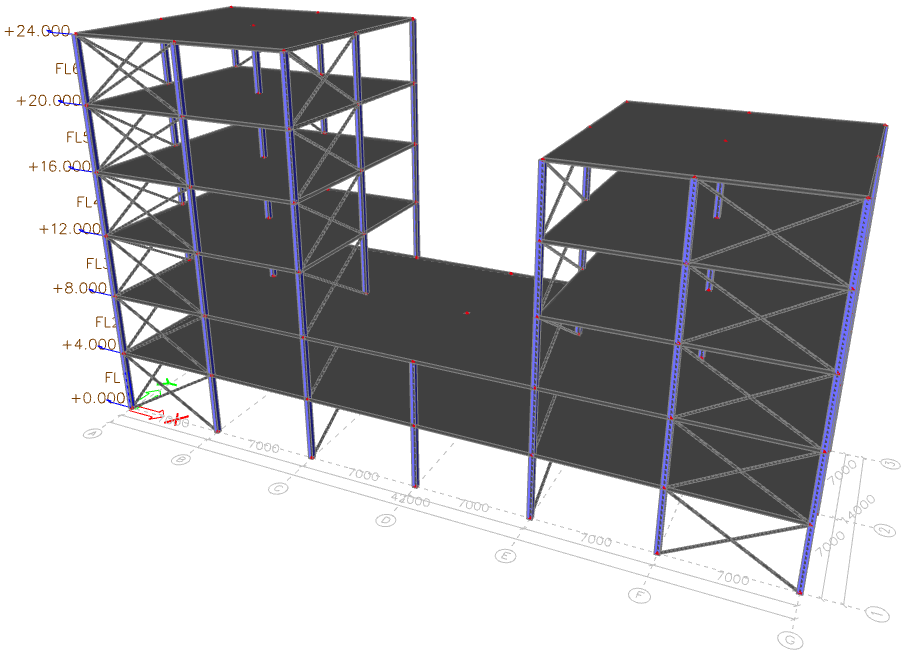
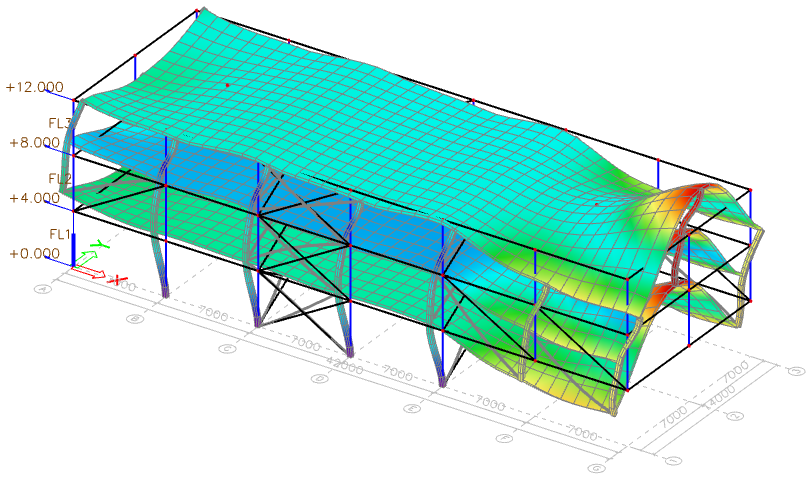
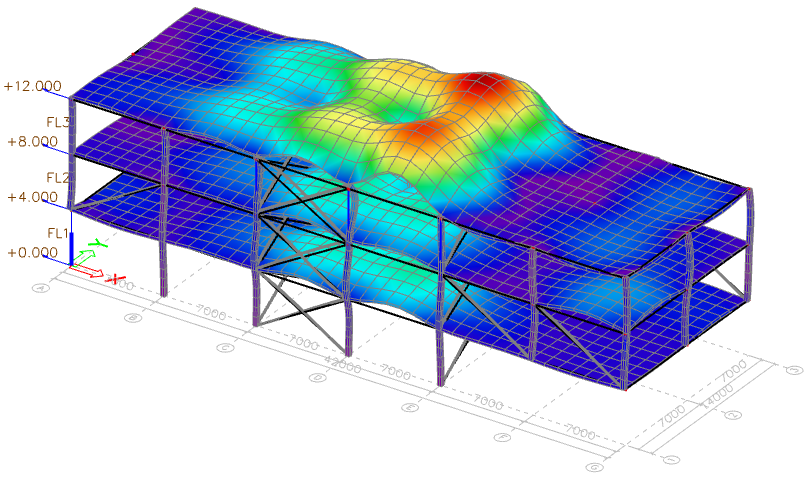
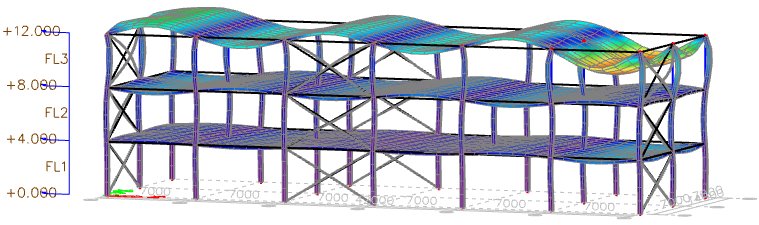
Example 2: structure with large, irregular spans
In this example, span lengths are irregular, both horizontally and vertically. Some columns are missing in some storeys, causing large variations of stiffness from one span to the other, as well as from one deck to the other.
Only significant vertical modes are presented here. Horizontal modes (translational and rotational) are very good matches, which is usually the case for that type of structure.
| Standard analysis (original mesh) | IRS analysis | ||||
| Mode | f [Hz] | Wzi/Wztot | Mode | f [Hz] | Wzi/Wztot |
| 3 | 1.973 | 7.1% | 4 | 2.178 | 8.8% |
|

|
||||
| 5 | 2.139 | 17.1% | 5 | 2.395 | 43.6% |
|
|
||||
| 6 | 2.712 | 27.6% | 6 | 2.952 | 9.7% |
|
|
||||
| 14 | 4.843 | 2.8% | |||
|
missing | ||||
| 15 | 4.933 | 3.2% | |||
|
missing | ||||
| 19 | 5.084 | 10.0% | |||
|
missing | ||||
| 31 | 5.560 | 4.7% | |||
|
missing | ||||
| 71 | 8.074 | 6.6% | |||
|
missing | ||||
| Total 100 modes | 92.1% | Total 24 modes | 62.6% | ||
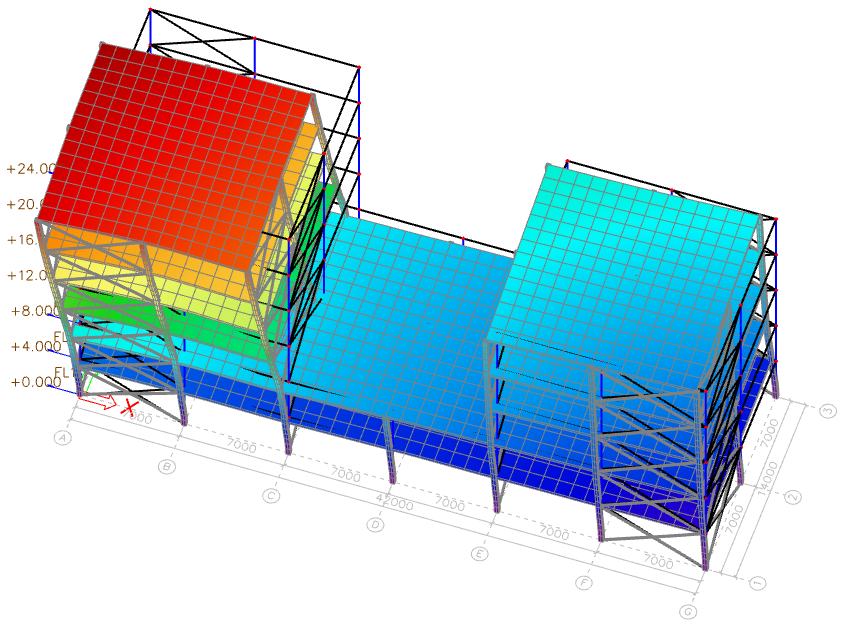
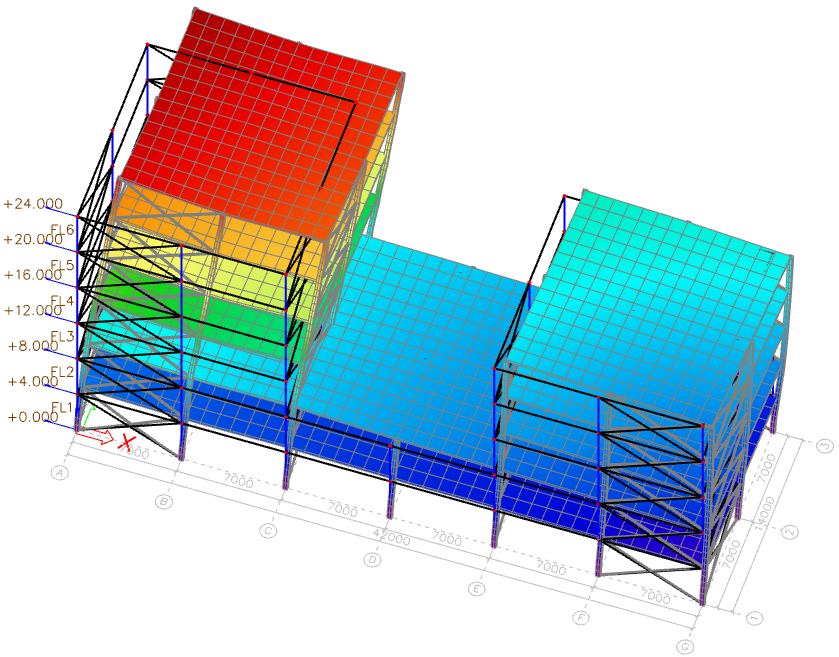
The first 3 presented modes have similar shape, but discrepancies are already visible, both in frequency and in modal mass ratio values. Mode 5 is particularly striking, with its modal mass ratio jumping from 17.1% (standard analysis) to 43.6% (IRS), showing that the mode shapes are very different.
The rest of the significant vertical modes (above 3 Hz) are missing in the IRS analysis.
Again, as in the first example, the cumulated modal mass ratio for all 24 modes is very low: only 62.6% (see the remarks about that at the end of example 1).
In general, structures where significant dynamic amplification is to be expected due to the vertical components should not be calculated using IRS analysis. At the very least, if IRS analysis cannot be avoided for the final calculation, IRS modal analysis results should be validated using a standard analysis.
Flexible structures without diaphgram
In multi-storey buildings, a large part of the mass of the structure is concentrated at the level of the decks, which act as rigid or semi-rigid diaphragms. That's what allows to create a reduced system and carry out the IRS analysis. As a matter of fact, it is the same assumption that is used in hand calculation techniques (ELF method).
When the mass is more evenly distributed in the structure and/or in the absence of diaphragms, it is imperative, that a standard modal analysis to validate the IRS analysis results, as the approximation used for modal analysis may induce dependencies between parts of the structure that are lnked to the same reduction point and are disconnected from each other in reality.
If the fundamental modes obtained from IRS analysis are similar to those produced by a standard modal analysis, then the reduced system can be used safely for modal analysis, as well as for accidental eccentricity and/or ELF calculations.
In case IRS fundamental modes diverge significantly from standard analysis results, then IRS analysis must be considered with caution.
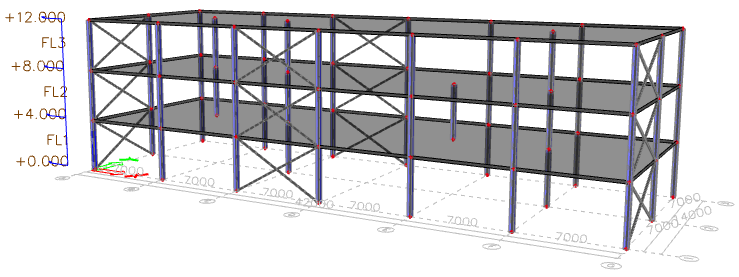
Example: steel frame structure
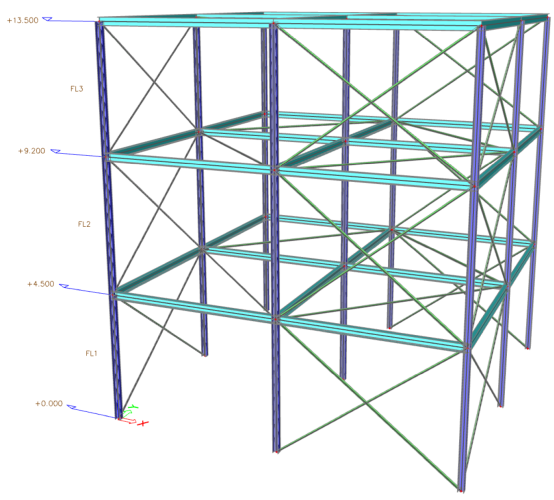
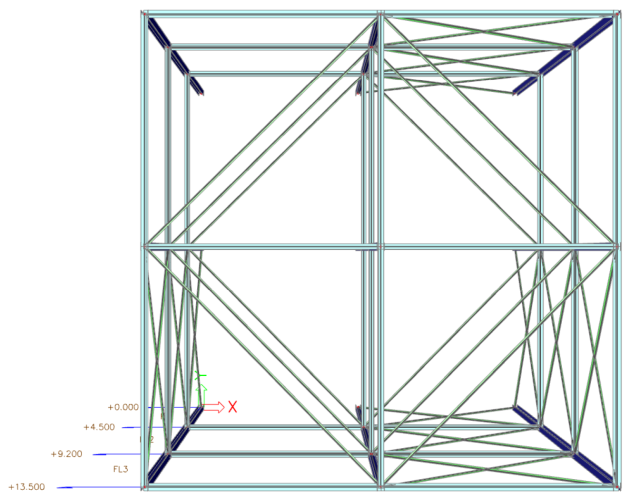
This example is a simple braced frame structure, without diaphragms. Floor masses are assigned directly to the beams of each floor.
| Standard analysis (original mesh) | IRS analysis | ||||
| Mode | f [Hz] | Wxi/Wxtot | Mode | f [Hz] | Wxi/Wxtot |
| 1 | 0.88 | 31.1% | 1 | 0.97 | 43.7% |
|
|
||||
| 10 | 0.96 | 6.1% | 2 | 0.98 | 23.3% |
|
|
||||
| 13 | 1.20 | 17.4% | 19 | 9.00 | 24.4% |
|
|
||||
| 37 | 2.14 | 12.0% | |||
|
|||||
| 38 | 2.19 | 12.1% | |||
|
|||||
| Total 50 modes | 92.9% | Total 24 modes | 97.7% | ||
Standard analysis distributes to 5 modes most of the effective mass in X direction, all frequencies in a range between 0.9 and 2.2 Hz.
IRS analysis gives the first 2 modes in X direction, with a significant part of the effective mass in that direction and frequencies around 1.0 Hz, which all looks reasonable. But it also gives one more mode (19) an important part of the effective mass, with a frequency of 9.0 Hz and a mode shape that is completely different from all other results, with deformations concentrated in the lower part of the columns. Also, the fact that IRS analysis gives a cumulated modal mass ratio of 97.7% is not an indication of quality, as a quarter of that sum is due to a mode shape of poor quality.
One should keep in mind, that IRS analysis is most accurate for fundamental modes. For higher order modes, on the other hand, the quality of the approximation is degrading, as more and more local modes tend to be aggregated due to the reduced number of degrees of freedom. When high order modes gather a significant share of the modal mass ratio, it does not necessarily mean that they are incorrect, however their quality must be evaluated individually.
In this particular case, the quality of the solution is clearly insufficient and IRS analysis should be avoided.